
Icarus Asia Research · China Financials · Special Report
Half as safe
as it looks
PBOC monetary survey data puts Chinese banks' net foreign assets near $1.5 trillion. BoP-consistent SAFE data says $624 billion. The whole gap sits on the liability side, where $1.49 trillion of gross external obligations still needs watching.
July 2026 · Framework note, building on Rasmussen (Exante Data, July 2026) · Key figures verified against primary SAFE releases
Executive Summary
This report refines and expands a framework for assessing Chinese banks' external debt and net external asset position. It builds on Martin Rasmussen's Exante Data note "A better way to measure Chinese banks' external position" (July 2026), adding data triangulation, granular decompositions, cross-validation routes via BIS and IMF sources, and forward-looking risk overlays. Figures below are verified against primary SAFE releases unless labelled otherwise.
- Net external assets. SAFE-consistent measures put banks' net external position at $566.5bn at end-2025 and $623.6bn at Q1 2026 (SAFE releases), far below PBOC Monetary Survey NFA of ~$1,521bn in May 2026 (via Exante Data). The gap is definitional and sits on the liability side.
- Gross external liabilities. $1,411.0bn at end-2025, $1,485.1bn at Q1 2026 (SAFE releases). Broadly stable in level, and still in need of scrutiny for rollover, currency and concentration risk despite the asset buffer.
- Drivers. The rise in net external assets reflects policy-linked trade-surplus recycling and RMB trade finance, not market-driven leverage or carry strategies.
- What this report adds. A monthly proxy validation routine, instrument/currency/counterparty decompositions, policy-bank considerations, four stress scenarios, and BIS cross-checks.
The practical toolkit in Section 7 sets out explicit risk metrics, scenario overlays, and a monitoring cadence for analysts covering China's banking system from the outside.
1Conceptual Foundations
Chinese banks' external position, on a balance-of-payments basis, is the stock of financing they provide to non-residents (external assets) against the stock of financing non-residents provide to them (external liabilities). External debt is the subset of those liabilities made up of credit and securities obligations to non-residents, often FX-denominated, and it is the part of the balance sheet that carries rollover, liquidity and currency risk.
The two concepts are routinely conflated, and the conflation matters. A large positive net external position can coexist with large gross external liabilities that still have to be refinanced on schedule and in the right currency. Net figures are context. Gross liabilities are the risk object.
China adds a further layer: the banking system is mostly state-owned, and its external balance sheet is an instrument of macro policy. Banks absorb foreign exchange generated by the trade surplus, slow RMB appreciation, extend RMB trade credit that supports exporters, and carry offshore lending tied to RMB internationalization. Accumulation of net external assets is therefore structural and policy-driven, which shapes both what the assets look like and how sticky the liabilities are.
2Official Datasets: Strengths, Limitations, Triangulation
Four official datasets bear on Chinese banks' external position. They disagree, and the disagreement itself is the diagnostic.
| Dataset | Frequency | Design basis | Best use | Key limitation |
|---|---|---|---|---|
| PBOC Monetary Survey (ODC balance sheet) | Monthly | IMF monetary statistics, not BoP | Momentum; bank-type granularity | Narrow liability definition inflates NFA |
| SAFE Banking Sector External Position | Quarterly | BoP principles | Levels; instrument/currency composition (the anchor) | Quarterly lag; no bank-type split |
| SAFE Sectoral IIP | Annual | BoP / IIP | National balance-sheet embedding; cross-check | Annual; short history |
| PBOC Sources & Uses of Credit Funds | Monthly | Legacy credit-allocation monitoring | Monthly proxy construction; decomposition | Not BoP-consistent; definitional quirks |
Source: Rasmussen, Exante Data (July 2026); Icarus Asia synthesis. Column judgments ("best use") are Icarus Asia editorial characterizations of the note's findings.
2.1 PBOC Monetary Survey
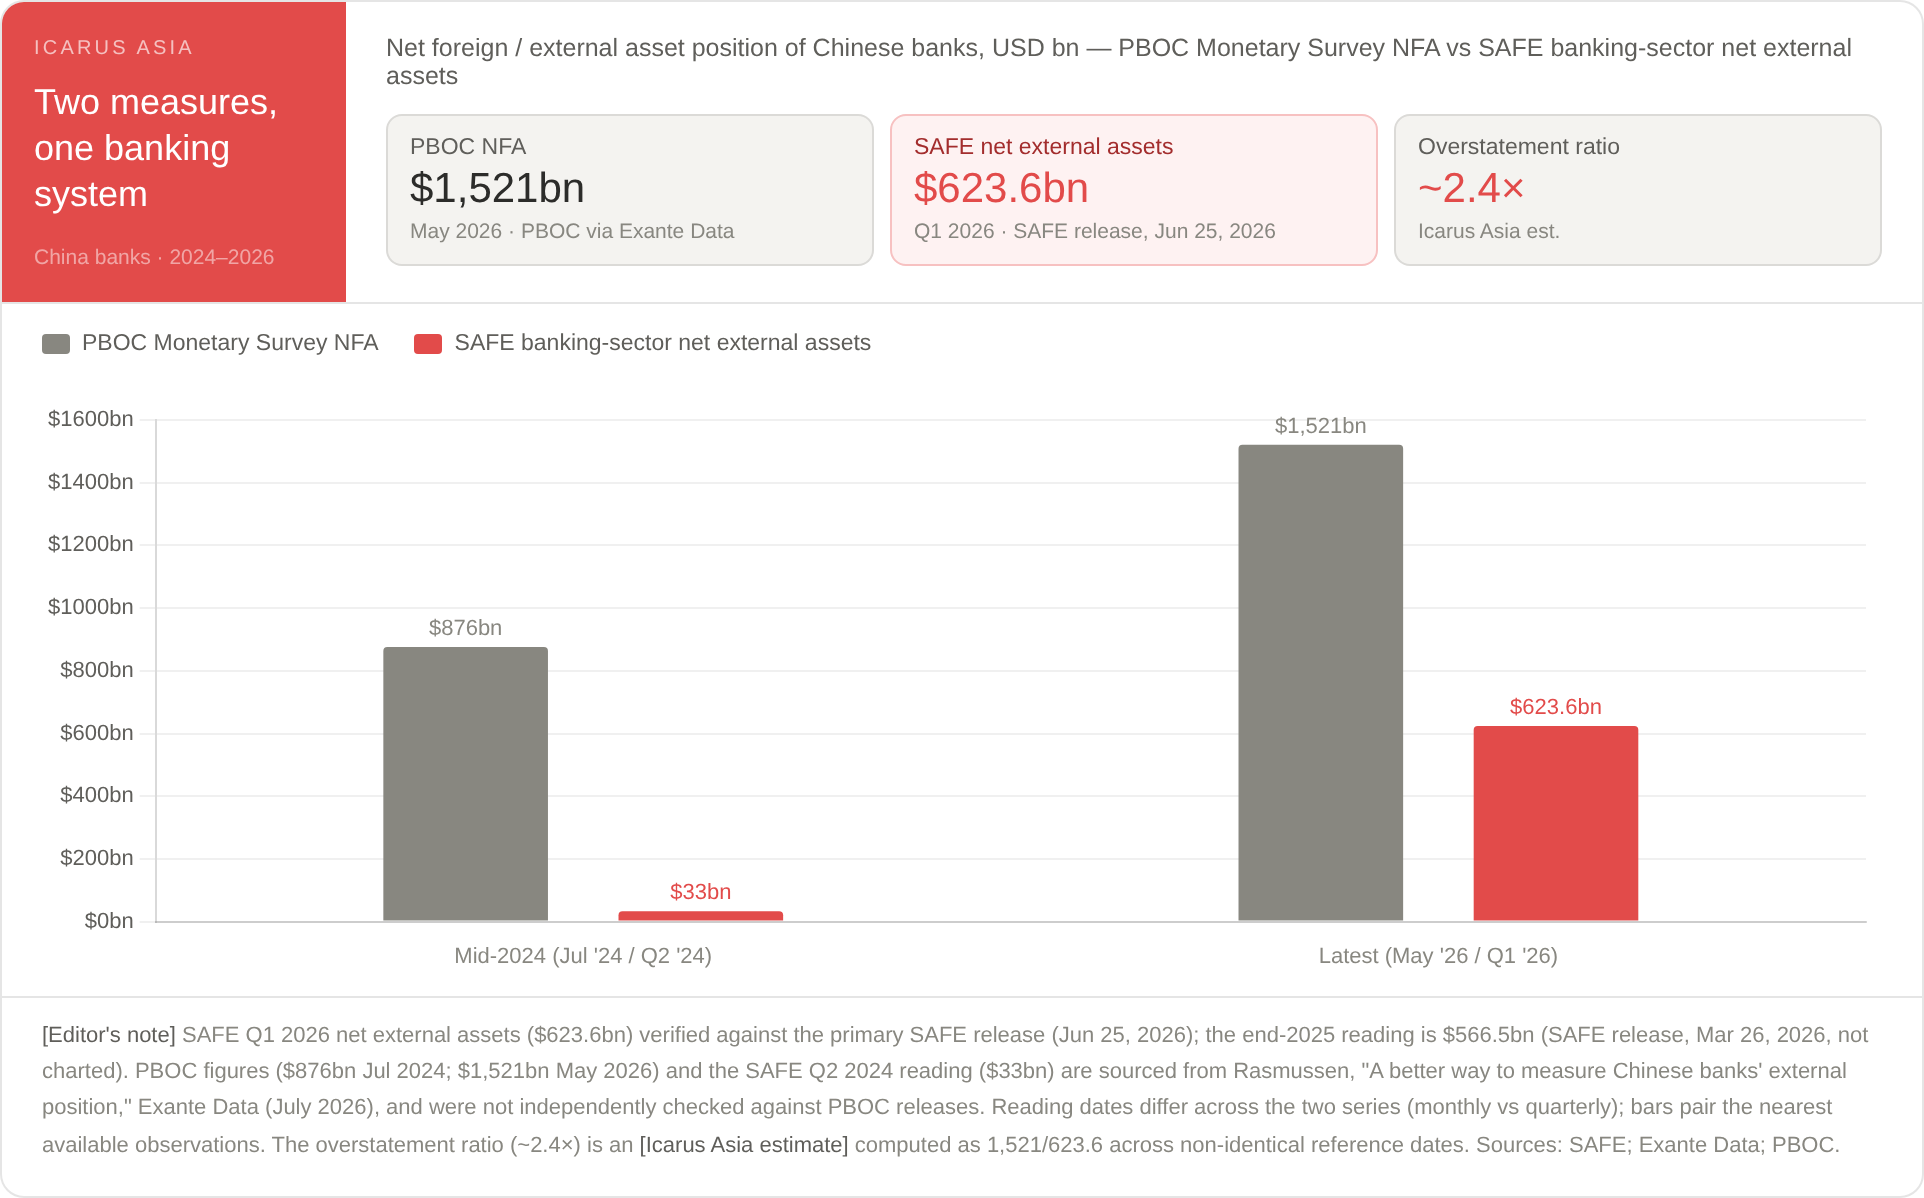
The PBOC's monthly Balance Sheet of Other Depository Corporations is built to measure domestic monetary conditions on IMF principles, not external accounts. On this basis, banks' net foreign assets stood at roughly $1,521bn in May 2026, up from about $876bn in July 2024, an increase of some $645bn in under two years (via Exante Data).
The series is widely used, including by the IMF in its Article IV external-vulnerability tables, and it offers something SAFE does not: a breakdown by bank type, connecting to balance-sheet data for domestic and foreign-funded banks. But external positions appear only as aggregate "foreign assets" and "foreign liabilities," with no instrument split. As Section 3 shows, the liability aggregate is narrow enough to approximate offshore RMB deposits alone. It is a momentum gauge, not a level measure.
2.2 SAFE Banking Sector External Position: the anchor
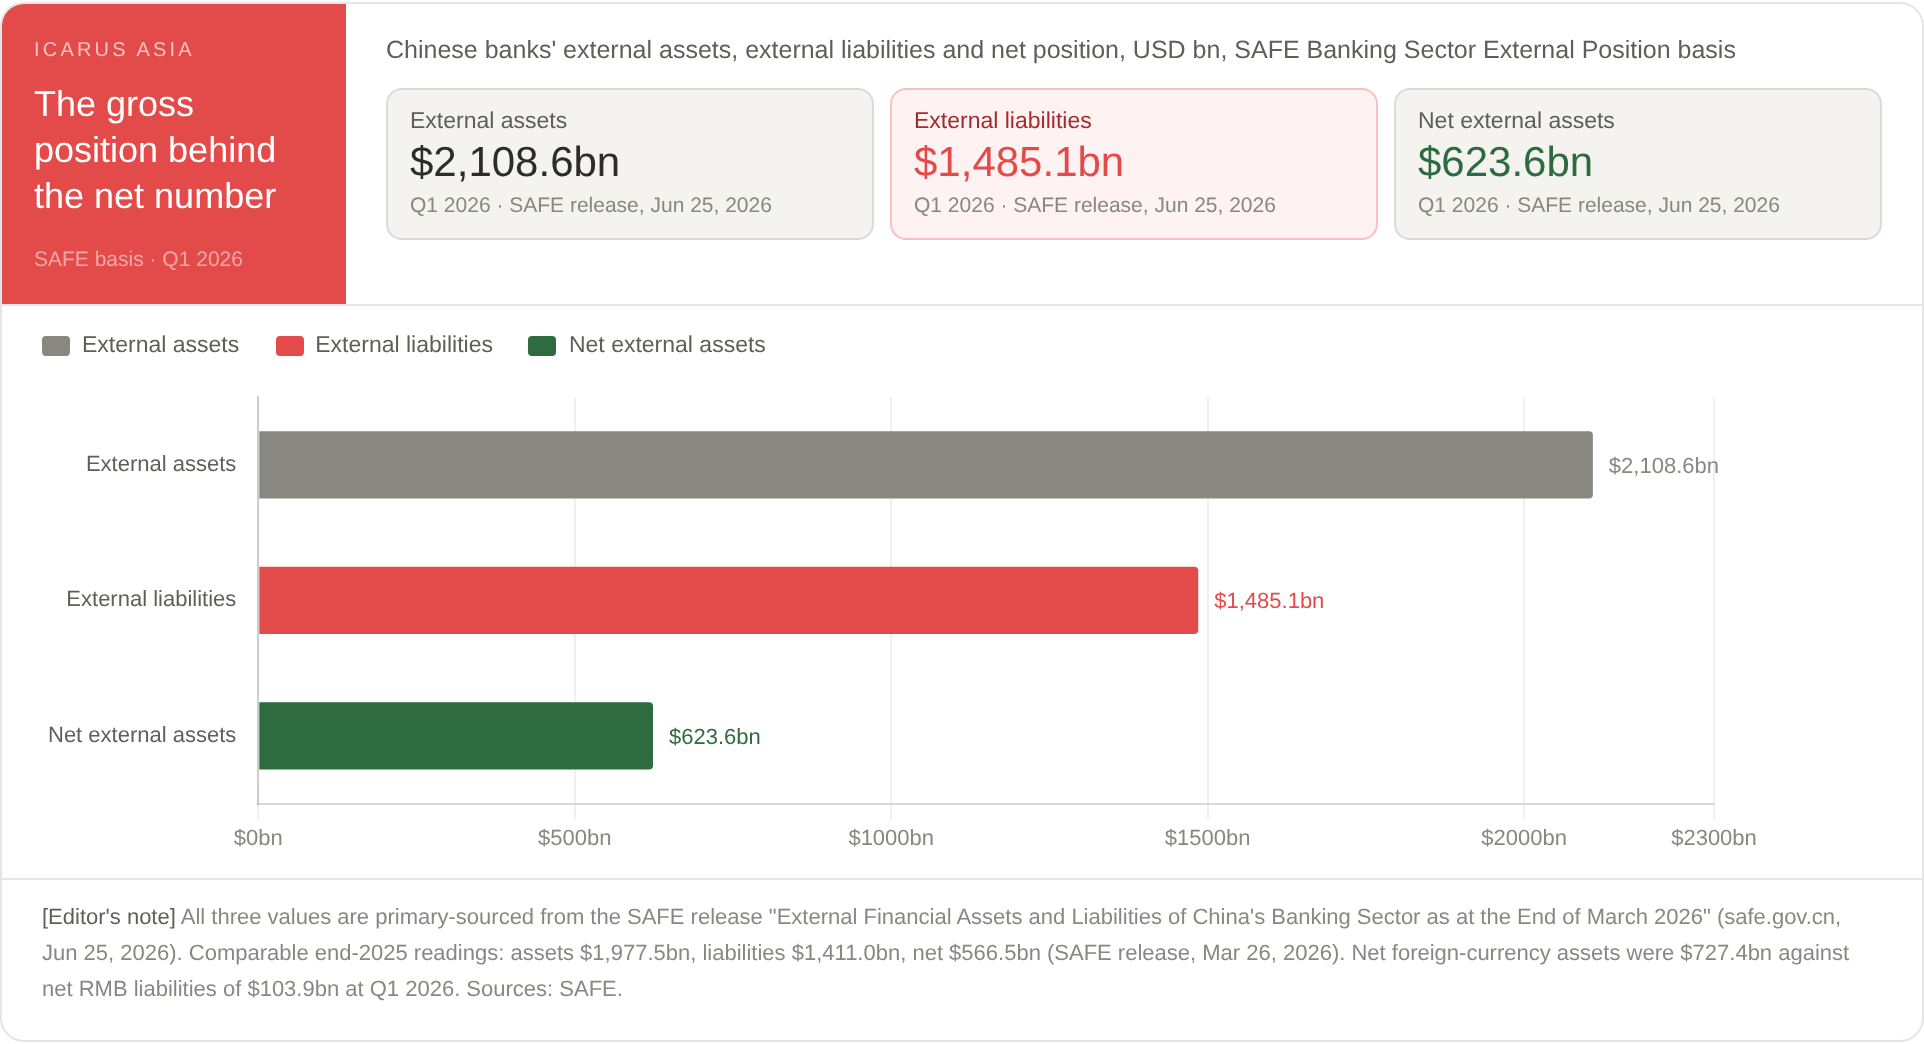
SAFE's quarterly External Assets and Liabilities of China's Banking Sector is designed on BoP principles precisely to measure what the PBOC survey does not: banks' external assets and liabilities by instrument and by currency. Net external assets rose from about $33bn in Q2 2024 (via Exante Data) to $566.5bn at end-2025 and $623.6bn at end-March 2026 (SAFE releases). Gross external assets stood at $1,977.5bn at end-2025 and $2,108.6bn at Q1 2026; gross liabilities at $1,411.0bn and $1,485.1bn respectively.
The instrument, currency and counterparty detail makes this the natural starting point for gross external debt analysis. Quarterly frequency and the absence of a bank-type split are acceptable costs for conceptual alignment with BoP accounting.
| Dimension | End-2025 (USD bn / %) | Q1 2026 (%) |
|---|---|---|
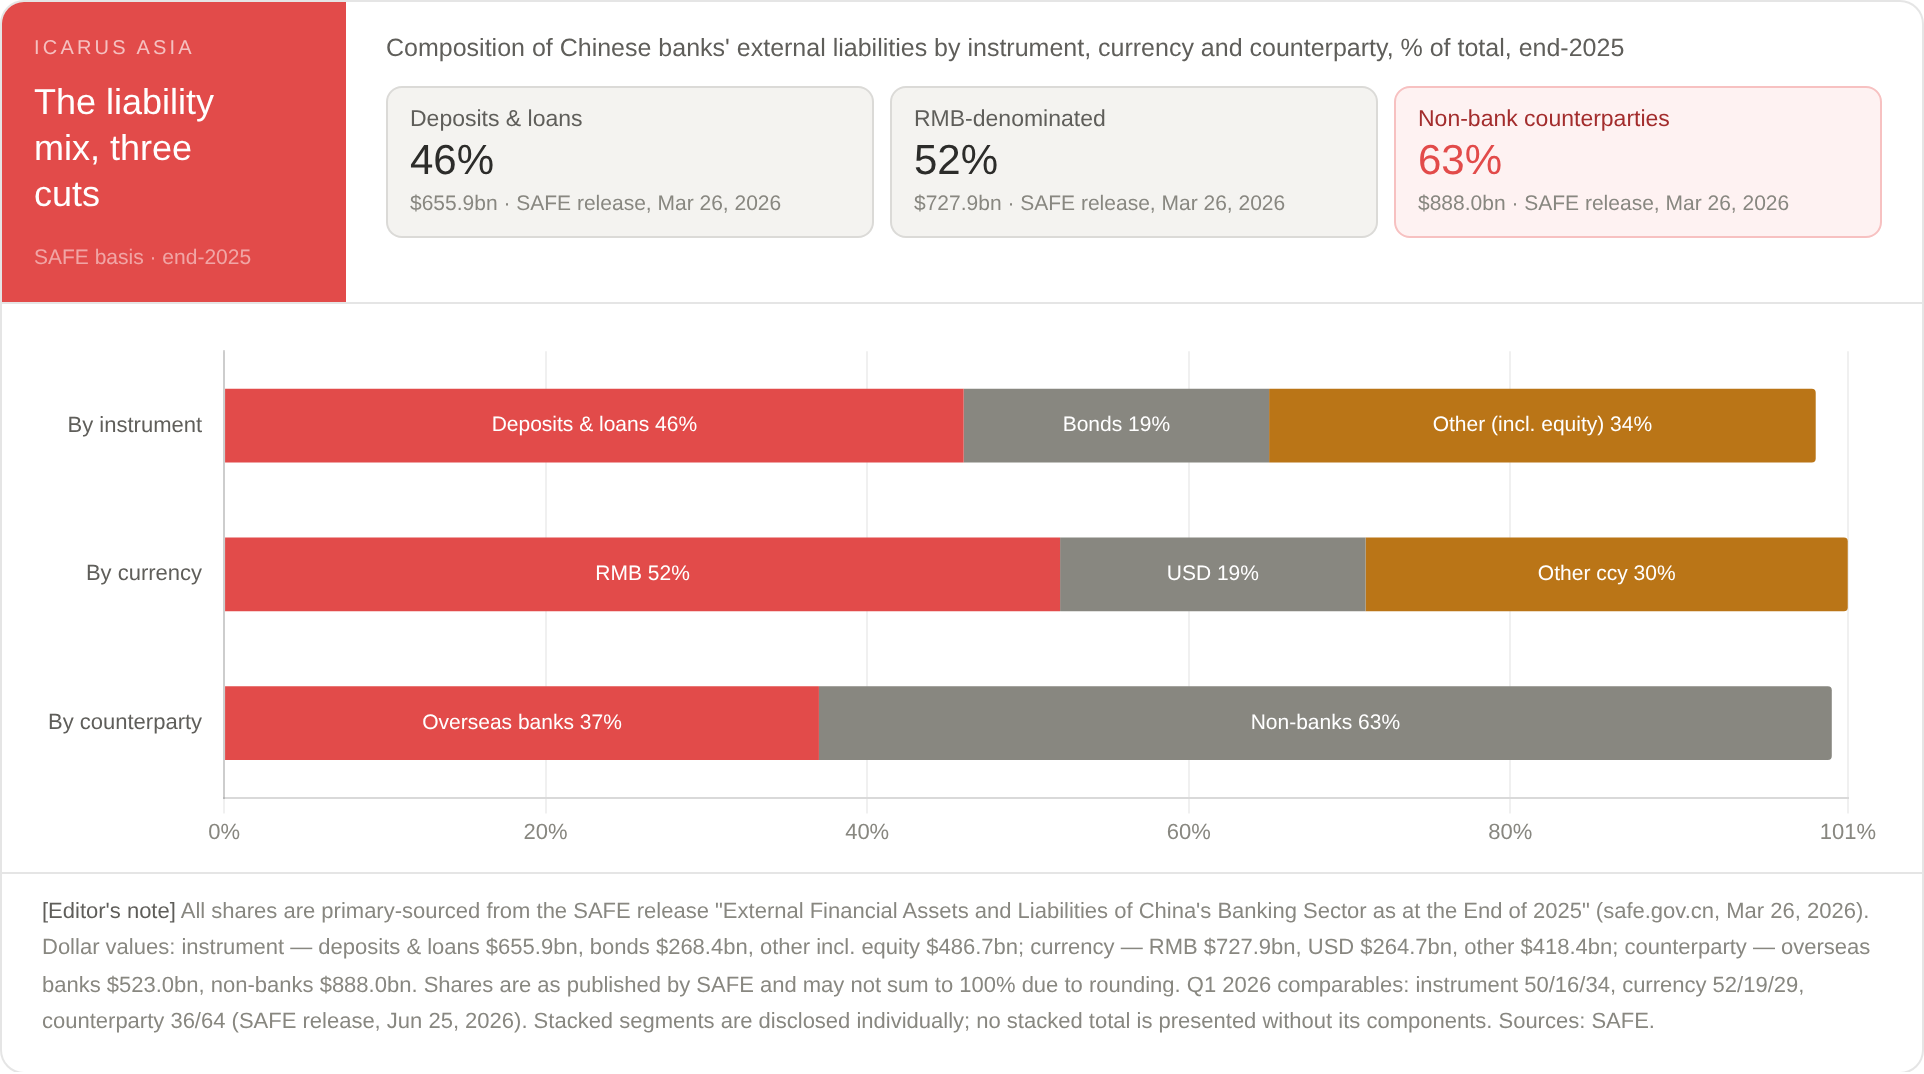
| By instrument | Deposits & loans $655.9 (46%) · Bonds $268.4 (19%) · Other incl. equity $486.7 (34%) | 50% · 16% · 34% |
| By currency | RMB $727.9 (52%) · USD $264.7 (19%) · Other $418.4 (30%) | 52% · 19% · 29% |
| By counterparty | Overseas banks $523.0 (37%) · Non-banks $888.0 (63%) | 36% · 64% |
Source: SAFE releases, "External Financial Assets and Liabilities of China's Banking Sector," end-2025 (published Mar 26, 2026) and end-March 2026 (published Jun 25, 2026), safe.gov.cn. Shares as published by SAFE; totals may not sum to 100% due to rounding.
2.3 SAFE Sectoral IIP and Cross-Checks
SAFE's sectoral breakdown of the annual IIP includes a banking-sector line that is broadly consistent in magnitude with the quarterly banking-sector dataset, and it does two jobs: it confirms the SAFE banking dataset as the right BoP-consistent benchmark, and it embeds banks' position in the national external balance sheet.
One vintage note. The client-supplied summary of the Exante Data note quotes roughly $439bn for the SAFE banking-sector dataset at end-2025 against roughly $566bn on the sectoral IIP. The current primary SAFE release states $566.5bn for the banking-sector dataset itself at end-2025. The $439bn figure likely reflects an earlier data vintage; SAFE notes it has improved its data revision mechanism since 2025.
2.4 PBOC Sources & Uses of Credit Funds
Built from the same raw data as the Monetary Survey, the Sources & Uses dataset provides a far more detailed cut by instrument and currency. It was designed decades ago to monitor administratively directed credit and does not follow BoP principles, but it decomposes exactly the aggregates the Monetary Survey obscures. Foreign assets can be well approximated by overseas loans (FX and RMB) plus non-loan FX assets. The same decomposition on the liability side exposes what the PBOC aggregate omits, including interbank deposits and certain onshore deposits by non-residents.
Asset levels align across PBOC and SAFE sources. Liability definitions do not, and the liability gap is the whole story behind the NFA divergence. BIS locational banking statistics offer an external mirror on counterparty exposures for validation.
3Why PBOC Overstates the Net Position: The Evidence
The divergence between datasets arises on the liability side, not the asset side. Foreign-asset levels are of similar magnitude across the PBOC Monetary Survey and SAFE; external liabilities in the PBOC data are much smaller. The Monetary Survey pairs a wide definition of foreign assets with a narrow definition of foreign liabilities, which mechanically inflates NFA relative to a BoP-consistent measure. At current readings the inflation exceeds a factor of two.
Three strands of evidence pin down what the PBOC liability line actually captures:
- Co-movement with offshore RMB deposits. PBOC "foreign liabilities" correlate closely with overseas RMB deposits. An onshore study cited by Rasmussen argues the PBOC line is effectively offshore RMB deposits, and recent co-movement supports this.
- Reconciliation against SAFE deposit data. Taking SAFE's external deposit liabilities, restricting to non-bank deposits, and subtracting onshore non-resident deposits produces a series that matches PBOC foreign liabilities well. Interbank deposits and some non-resident deposits are evidently missing from the PBOC aggregate.
- Proxy tracking. A Sources & Uses proxy (overseas loans plus non-loan FX assets, minus overseas deposits and non-deposit FX liabilities) tracks SAFE levels reasonably, while PBOC NFA changes track SAFE flows and direction better than the proxy does.
SAFE data through Q1 2026 confirm the pattern: gross liabilities rose a moderate $74bn over the quarter while assets rose $131bn. The conclusion for practitioners is blunt. PBOC Monetary Survey NFA cannot be treated as a BoP-consistent net external asset figure, and any debt assessment that starts there will understate gross liabilities and overstate the safety implied by the net position.
4Building Better Measures
4.1 The monthly proxy
Rasmussen constructs a monthly proxy for banks' net external assets from Sources & Uses categories: overseas loans (FX and RMB) plus non-loan FX assets (domestic and overseas), minus overseas deposits (FX and RMB) and non-deposit FX liabilities (domestic and overseas). The proxy correlates reasonably with SAFE's quarterly net external assets in level terms. The match is imperfect, but good enough to serve as a practical monthly gauge when SAFE data are not yet out. It can be refined further with regression adjustments for the residual.
One wrinkle is worth internalizing: on quarterly changes, PBOC Monetary Survey NFA tracks SAFE more closely than the proxy does. Levels and flows want different instruments.
4.2 The hybrid approach
- SAFE for levels and composition. Quarterly anchor for BoP-consistent stocks, instrument and currency splits.
- Sources & Uses for monthly granularity. Instrument-level tracking of overseas deposits, non-deposit FX liabilities, overseas loans, non-loan FX assets.
- PBOC Monetary Survey for momentum. High-frequency directional signal on the net position. Never a level measure.
- BIS / IMF for cross-validation. Locational banking statistics for counterparty mirrors; IIP/QEDS for consistency checks.
Updated proxy performance is stronger for changes than levels; level adjustments are needed for policy-bank and interbank subtleties.
5Implications for External Debt Assessment
5.1 Level and dynamics
Gross external liabilities are sizable and broadly stable: $1,411.0bn at end-2025, $1,485.1bn at Q1 2026 (SAFE). Net external assets rose sharply over the same period, which means the net improvement is asset-driven, not deleveraging. Two consequences follow. First, gross liabilities still need evaluation for rollover and concentration risk; the buffer mitigates, it does not immunize. Second, rapid asset accumulation changes asset-side risk itself, in currency and duration terms.
For maturity context, China's economy-wide external debt statistics show short-term debt at 56% of the $2,328.8bn total at end-2025, of which 39% was trade-related credit (SAFE external debt release). Banks accounted for $933.2bn, or 40%, of total external debt. Short-term external debt stood at 39.2% of FX reserves, inside the 100% international threshold. Trade-related credit sits mostly in the corporate sector rather than on bank balance sheets, but it is the channel through which a trade shock would hit external funding conditions first.
5.2 Composition and risks
Core funding. Overseas deposits (FX and RMB, with sticky RMB and non-bank elements) plus non-deposit FX liabilities (financial bonds, interbank obligations, liabilities to international financial institutions) form the core external funding base. Onshore deposits by non-residents are external from a BoP perspective and belong in the assessment even though the PBOC aggregate largely misses them.
Currency risk. Banks held net foreign-currency assets of $710.1bn at end-2025 and $727.4bn at Q1 2026, against net RMB liabilities of $143.6bn and $103.9bn (SAFE releases). The buffer is real. Gross USD liabilities of $264.7bn (19% of the total at end-2025) remain exposed to sanctions and dollar-liquidity shocks regardless of it, and Rasmussen stresses that trade-surplus recycling forces accumulation of mostly dollar assets, raising theoretical vulnerability to US financial sanctions even as RMB invoicing changes settlement modalities. The shift toward RMB in cross-border lending is ongoing.
Maturity. Short-term liabilities dominate enough of the profile that trade and policy shocks require monitoring through a term-structure lens: maturity profiles of bonds, deposits and interbank funding layered on top of SAFE and Sources & Uses data.
Concentration. Non-bank counterparties held 63% of external liabilities at end-2025 and 64% at Q1 2026 (SAFE). Policy banks add an offshore lending layer that sits partly outside core banking statistics.
Policy banks may not be fully captured in the PBOC Monetary Survey, even though large and medium-sized domestic banks make up the bulk of NFA in that dataset. Their offshore lending is significant in BoP "other" categories and in global claims data. Cross-referencing with AidData-style overseas-lending datasets fills part of the gap.
5.3 Stress scenarios
All four scenarios below are hypothetical stress overlays constructed by Icarus Asia. None is a forecast. The purpose is to identify which data series would move first and what to watch.
Scenario 1 — Trade shock
Trigger: material compression of the goods surplus (tariffs, demand slump).
Mechanism: asset accumulation slows or stops; the structural driver of net-position improvement stalls.
Test: rollover of short-term external funding. Trade-related credit, 39% of China's short-term external debt (SAFE, end-2025, economy-wide), contracts first and tightens conditions around bank trade finance.
Watch: SAFE quarterly liabilities by instrument; monthly proxy asset-side components.
Assumes no offsetting capital-account liberalization. The trade-credit share is an economy-wide external debt statistic, not a banks-only figure; on SAFE's sectoral table, trade credit sits in "other sectors" while banks' short-term external debt is mainly currency and deposits ($377.8bn), loans ($180.4bn) and debt securities ($135.6bn). Reserve backstop excluded from this scenario's first-order mechanics.
Scenario 2 — FX / sanctions squeeze
Trigger: US financial sanctions or a broad dollar-funding squeeze.
Mechanism: gross USD liabilities ($264.7bn, 19% of total at end-2025, SAFE) reprice or become unrollable; USD assets may be immobilized rather than liquid.
Buffers: net foreign-currency assets ($710.1bn end-2025; $727.4bn Q1 2026, SAFE) and the official reserves backstop.
Watch: currency split of SAFE liabilities; BIS LBS USD claims on Chinese banks.
Net FX buffer adequacy depends on asset liquidity under sanctions, which is precisely what a sanctions scenario impairs. The buffer should be haircut, not taken at face value; haircut size is unmodelled here.
Scenario 3 — Domestic spillover
Trigger: LGFV or tech-sector NPL deterioration pressures bank profitability and perceived credit quality.
Mechanism: external funding costs rise; non-bank depositors (63–64% of external liabilities, SAFE) are less sticky than interbank policy-aligned funding.
Watch: bond spreads on Chinese bank offshore issuance; deposit components of the monthly proxy.
Assumes domestic credit stress transmits to offshore funding sentiment without an explicit state guarantee announcement. State backstop probability is high but unquantified here.
Scenario 4 — Accelerated RMB internationalization
Trigger: policy push shifts more cross-border lending and settlement into RMB.
Mechanism: USD mismatch shrinks, but offshore RMB liquidity risk grows, since offshore RMB deposits (the effective content of the PBOC liability line) become a larger, more run-prone funding class. Net RMB liabilities already shrank from $143.6bn to $103.9bn over Q1 2026 as RMB assets grew.
Watch: RMB share of SAFE liabilities; offshore RMB deposit levels; PBOC "foreign liabilities" as an offshore-RMB tracker.
This is a structural rebalancing scenario, not an acute stress. The novel risk (offshore RMB liquidity) is qualitatively identified, not quantified.
The through-line: the net position cushions, but gross exposures and policy linkages determine resilience. A stress that impairs asset liquidity (Scenario 2) or stalls the policy engine (Scenario 1) degrades the cushion exactly when it is needed.
6Role of Policy and State Ownership
Chinese banks act as policy conduits. They absorb foreign exchange generated by trade surpluses, slowing RMB appreciation; they extend RMB-denominated trade credit that supports export financing; and they carry offshore lending associated with Belt and Road and RMB internationalization. Both sides of the external balance sheet are shaped by these mandates.
The credit implications cut both ways. State ownership lowers pure default risk: funding costs are lower, intervention capacity is real, and state banks are the operating arm of FX policy. But it also ties external balance-sheet stability to macro-policy continuity, because the same policy engine that built the net asset position could redirect it. External debt of Chinese banks should be read partly as an instrument of currency policy rather than market-driven leverage, which changes default-risk analysis, intervention mechanics, and the shape of any state backstop in stress.
7Practical Analyst Framework
- Anchor. SAFE Banking Sector External Position plus sectoral IIP for BoP-consistent stocks of external assets and liabilities.
- Monthly tracking. Sources & Uses proxy for instrument-level movement; PBOC Monetary Survey NFA changes for momentum.
- Decomposition. Instrument / currency / counterparty splits from SAFE, cross-checked against BIS locational banking statistics.
- Risk overlay. Maturity and FX mismatch matrices; scenario analysis of the type in Section 5.3.
- Policy context. Trade and RMB settlement flows, policy-bank adjustments, shadow-intervention proxies.
- Validation. Triangulate against IMF IIP/QEDS and BIS; monitor known gaps such as resident offshore deposits.
| Metric | Construction | Latest reading | Frequency |
|---|---|---|---|
| Gross external liabilities / GDP and / FX reserves | SAFE banking liabilities over nominal GDP; over official reserves | Economy-wide liability ratio 11.9% of GDP (SAFE, end-2025) | Quarterly |
| Short-term liability share and currency mismatch | SAFE maturity and currency splits; external debt statistics | Short-term debt 56% of total; 39.2% of FX reserves (SAFE, end-2025) | Quarterly |
| Net FX asset buffer under stress | Currency-matched assets minus liabilities, haircut for liquidity | $727.4bn net FX assets, unhaircut (SAFE, Q1 2026) | Quarterly + scenario |
| Proxy vs SAFE divergence | Monthly Sources & Uses proxy minus latest SAFE net position | Requires ongoing construction (Section 4) | Monthly |
Source: Icarus Asia framework, building on Rasmussen (Exante Data, July 2026). Latest readings from SAFE releases (Mar 26–27 and Jun 25, 2026). Metric constructions are Icarus Asia proposals; underlying series are official (SAFE, PBOC, BIS, IMF).
8Key Takeaways, Open Questions, Further Research
Core conclusion. PBOC Monetary Survey NFA overstates the safety of Chinese banks' external position because of a narrow liability definition; SAFE provides the superior basis for external debt assessment. Rising net external assets reflect structural trade-surplus recycling. Stable gross liabilities of roughly $1.5trn are the primary risk focus.
Patterns that hold. Two features appear in every dataset regardless of liability definition: the net improvement is asset-driven, and policy dominates.
Open and refinable areas. The treatment of offshore deposits by residents, interbank netting, and some non-deposit FX liabilities remains opaque across datasets; Rasmussen explicitly frames his synthesis as carefully developed hypotheses rather than definitive statistical guidance. Precise policy-bank consolidation, resident-versus-non-resident offshore distinctions, sharper monthly proxies, and long-term sustainability under slowing surpluses or capital-account liberalization are all live questions. So is data vintage: the end-2025 figure for the SAFE banking dataset circulating in secondary summaries ($439bn) does not match the current primary release ($566.5bn), a reminder to re-pull primary data before every use.
Recommended further research. Granular time-series decomposition with BIS mirror-data validation; full stress-testing models with macro linkages; updated policy-bank mapping using the latest global overseas-lending data; and comparative analysis against peer EM banking systems' external positions.
Bibliography
- Rasmussen, Martin. "A better way to measure Chinese banks' external position." Money: Inside and Out (Exante Data), July 2, 2026.
- SAFE. "External Financial Assets and Liabilities of China's Banking Sector as at the End of 2025." Mar 26, 2026. safe.gov.cn/en/2026/0326/2401.html.
- SAFE. "External Financial Assets and Liabilities of China's Banking Sector as at the End of March 2026." Jun 25, 2026. safe.gov.cn/en/2026/0625/2425.html.
- SAFE. "China's External Debt Data at the end of 2025." Mar 27, 2026. safe.gov.cn/en/2026/0327/2408.html.
- PBOC. Balance Sheet of Other Depository Corporations (Monetary Survey), monthly; Sources and Uses of Credit Funds of Financial Institutions, monthly. Cited via Exante Data.
- BIS. Locational and Consolidated Banking Statistics (referenced as cross-validation route; not analyzed in this report).
- IMF. IIP, QEDS, Article IV / FSAP materials on China (referenced as cross-validation route; not analyzed in this report).
Appendix A — Analyst Note
Prepared by: Icarus Asia Research · Date: July 2026.
Methodology. This report is a framework synthesis, not primary statistical research. Its analytical core (the dataset comparison, the liability-gap diagnosis, the monthly proxy, and the hybrid measurement approach) is drawn from Rasmussen (Exante Data, July 2026) as summarized in the source document supplied by the client. Icarus Asia contributions: the tabular triangulation format, the four stress-scenario overlays, the key-metrics monitoring panel, the policy-bank cross-referencing suggestion, primary-source verification of SAFE figures, and editorial interpretation throughout.
Key assumptions. (i) SAFE banking-sector and external debt figures were verified directly against the primary releases on safe.gov.cn (see Appendix B). (ii) PBOC Monetary Survey figures ($876bn Jul 2024; $1,521bn May 2026) and the SAFE Q2 2024 reading ($33bn) arrive via the Exante Data note and were not independently checked against PBOC releases. (iii) Stress scenarios assume no simultaneous compound shocks. (iv) No access to the underlying Exante Data charts or raw series.
Material changes from the first draft. Verified previously unconfirmed client-brief figures against primary SAFE releases; all composition shares, gross levels, net FX assets and the trade-credit share confirmed and upgraded to primary-sourced status with exact values. Corrected the end-2025 SAFE banking net figure treatment ($566.5bn per primary release; the $439bn quoted in the client-supplied summary appears to be an earlier vintage). Added economy-wide external debt context (banks' $933.2bn share; 39.2% short-term debt to reserves; 11.9% liability ratio). Added banks' short-term external debt instrument detail to Scenario 1. Prose edit for publication style. Repositioned Figure 1.
Appendix B — Primary Source Verification
| Source | Type | Date | Access | Claims supported |
|---|---|---|---|---|
| SAFE, "External Financial Assets and Liabilities of China's Banking Sector as at the End of 2025" (safe.gov.cn/en/2026/0326/2401.html) | Official statistics — verified directly | Mar 26, 2026 | Public; consulted Jul 2, 2026 | End-2025: assets $1,977.5bn; liabilities $1,411.0bn; net $566.5bn; net FX assets $710.1bn; net RMB liabilities $143.6bn; liability splits 46/19/34 (instrument), 52/19/30 (currency), 37/63 (counterparty); Table 2; Figure 3 |
| SAFE, "External Financial Assets and Liabilities of China's Banking Sector as at the End of March 2026" (safe.gov.cn/en/2026/0625/2425.html) | Official statistics — verified directly | Jun 25, 2026 | Public; consulted Jul 2, 2026 | Q1 2026: assets $2,108.6bn; liabilities $1,485.1bn; net $623.6bn; net FX assets $727.4bn; net RMB liabilities $103.9bn; liability splits 50/16/34, 52/19/29, 36/64; Figures 1–2 |
| SAFE, "China's External Debt Data at the end of 2025" (safe.gov.cn/en/2026/0327/2408.html) | Official statistics — verified directly | Mar 27, 2026 | Public; consulted Jul 2, 2026 | Total external debt $2,328.8bn; short-term 56%, of which 39% trade-related credit; banks $933.2bn (40%); short-term debt 39.2% of FX reserves; liability ratio 11.9%; banks' short-term instrument detail (Scenario 1 footnote) |
| Rasmussen, "A better way to measure Chinese banks' external position," Exante Data / Money: Inside and Out | Analytical note | Jul 2, 2026 | Subscriber content; summarized in client-supplied document | PBOC NFA figures ($876bn Jul 2024; $1,521bn May 2026); SAFE Q2 2024 net ($33bn); liability-gap diagnosis; proxy construction; policy interpretation |
| Client brief ("updated report" structure) | Client-supplied synthesis | Jul 2026 | Private | Report structure and scenario framing. Its data claims have been superseded by direct primary verification above; its end-2025 SAFE banking net figure (~$439bn, attributed to the Exante note) conflicts with the primary release and was not used |
Note: All SAFE figures in this report were verified directly against the primary releases listed above on July 2, 2026. PBOC Monetary Survey figures remain sourced via the Exante Data note; checking them against PBOC's published ODC balance sheet (CNY-denominated, requiring FX conversion) is the remaining verification step before any use that depends on their precision.
Forward-looking statements. This report contains forward-looking statements based on current assumptions and estimates. Actual outcomes may differ materially. Icarus Asia makes no representation as to the completeness or accuracy of this analysis. This is not investment advice.
Conflicts of interest. Icarus Asia Research has no investment banking relationship with any issuer or institution mentioned in this report. No positions are held in the securities discussed. Readers should independently verify all information before making investment decisions.
Sourcing. SAFE figures are verified against primary releases (Appendix B); PBOC Monetary Survey figures are sourced via Exante Data. The stress scenarios in Section 5.3 are hypothetical overlays constructed by Icarus Asia, not forecasts.
© 2026 Icarus Asia Research · July 2026