
Icarus Asia Research · Institutional Policy Analysis
The Narrow Case
for US–China Gold Diplomacy
Why a US statutory gold revaluation is a balance-sheet exercise, not a monetary regime change, and what fifty years of monetary history actually teach about the limits of coordinated adjustment.
July 2026
Prepared for circulation among U.S. Treasury, Federal Reserve, and PBOC staff; China’s Ministry of Finance; sovereign reserve managers; and G20 policy officials.
Executive Summary
This paper examines the technical role of official gold reserves in US–China monetary relations and asks whether a US statutory gold revaluation could improve sovereign balance-sheet optics while opening narrow, graduated space for financial-stability dialogue. It stays close to verifiable data, existing legal frameworks, and historical precedent, and treats every forward-looking figure as conditional rather than predictive.
The United States holds an estimated 8,133 tonnes of official gold1, carried on Treasury’s books at the statutory price of $42.22 per ounce, a figure fixed by Congress in 1973 and unchanged since2. Marking that stock to a market-adjacent price would generate a large accounting gain, plausibly in the range of several hundred billion to over a trillion dollars depending on the price chosen3, without any new borrowing or physical transaction. The effect runs through balance-sheet presentation and liquidity management, not through the fiat monetary framework itself, provided officials communicate it as such.
China’s reported reserves reached approximately 2,346 tonnes as of end-June 2026, following twenty consecutive months of central-bank purchases4. Gold still represents less than 10 percent of China’s total reserve portfolio5. For both countries, gold functions as a non-yielding insurance asset, not an instrument of active policy.
Neither position emerged in a vacuum. The $42.22 statutory price is the last surviving artifact of a monetary order (Bretton Woods) that collapsed fifty years ago. China’s buying is the latest chapter in a central-bank gold cycle that only began after the 2008 financial crisis. And the two countries’ broader monetary friction has its own three-decade history of peg changes, manipulator disputes, and internationalization pushes. This report treats all three threads as necessary context, not background color: the feasible scope of any bilateral dialogue is bounded by what these histories show did and did not work before.
The 1985 Plaza Accord remains the clearest precedent for coordinated currency intervention: it delivered a rapid, engineered dollar depreciation and a corresponding 40–50 percent appreciation of the yen over the following two years. Japan’s policy response (aggressive monetary easing paired with fiscal stimulus) interacted with financial deregulation to inflate an asset bubble whose collapse produced the "lost decade." The transferable lesson is not that currency coordination is inherently dangerous, but that asymmetric adjustment, prolonged credit-fueled offsets, and delayed recognition of bad loans compound into structural stagnation.
Scenario Overview
Base case
Incremental technical exchanges, plus a possible modest US revaluation, yield marginal stability gains and sharper mutual visibility into balance-sheet pressures on both sides.
Upside
Sustained low-level coordination supports smoother macroeconomic adjustment and reduces the odds of miscommunication during a stress event.
Tail risks
Market misreads a revaluation as a signal about the dollar’s gold backing; domestic political vetoes stall action; or reserve diversification accelerates unpredictably. Cautious sequencing and explicit framing mitigate, but do not eliminate, this risk.
Policy pathway. Phase 1 centers on confidence-building technical dialogue and internal reviews; Phase 2 tests operational tools such as expanded liquidity facilities; the longer horizon is multilateral research through the IMF and BIS. Domestic discipline (US fiscal prudence alongside any revaluation, Chinese emphasis on financial-system resilience) remains the foundation neither workstream can substitute for.
Gold revaluation and fifty years of monetary history do not add up to a comprehensive fix for US–China monetary frictions. They point to a narrower opportunity: reducing tail risk and improving mutual understanding through graduated, reversible steps, without touching the core architecture of either country’s monetary arrangements.
1Global Monetary Context and Reserve-Asset Dynamics
The international monetary system runs on fiat foundations: flexible exchange rates and deep, interconnected capital markets transmit policy divergence quickly and, at times, violently. Reserve managers optimize for liquidity, safety, and return, with diversification increasingly used to manage concentration risk in any single currency or asset class.
Gold's appeal as a reserve asset rests on the absence of counterparty risk and a long record of holding value through stress periods. Central-bank gold purchases have risen over the past several years amid geopolitical tension and concern over debt sustainability in reserve-currency issuers. Its drawbacks are equally real: gold pays no yield and its price is volatile, which caps its usefulness for day-to-day liquidity management.
US and Chinese reserve positions anchor large portions of the system. Diversification trends are visible but gradual; abrupt shifts risk self-inflicted costs through valuation swings and market disruption. Any credible policy dialogue has to start from that reality, and from the shared incentive both sides have in containing volatility, preserving liquidity through stress, and keeping fiscal and monetary frameworks credible.
Little of this is new. The remainder of this report leans on four historical threads: the statutory gold price, the post-2008 central-bank buying cycle, the Plaza and Louvre accords, and the three-decade arc of US–China monetary friction, before returning to the present-day balance-sheet and dialogue questions.
2From Bretton Woods to $42.22: A History of the Statutory Gold Price
The United States has revalued its official gold price exactly twice in the past ninety years, and both revaluations happened under monetary duress. The first came in 1934: at the depth of the Depression, the Gold Reserve Act raised the official price from $20.67 to $35 per fine troy ounce, part of Franklin Roosevelt's broader effort to reflate the economy after Executive Order 6102 (1933) required most private gold holdings to be surrendered to the Federal Reserve. The Act also transferred title of Federal Reserve gold to the Treasury in exchange for gold certificates, the same legal mechanism a modern revaluation would likely reuse. The Fort Knox depository, built in 1936–37, was constructed specifically to consolidate the enlarged federal holdings that followed.
That $35 price became the anchor of the post-war order agreed at Bretton Woods in 1944: the dollar was pegged to gold, and every other major currency was pegged to the dollar, making the dollar-gold link the hinge of the entire system. The arrangement carried a structural flaw economists later named the Triffin dilemma: the world needed a growing supply of dollars to fund expanding trade and reserves, but every additional dollar issued abroad was, in principle, a new claim on a fixed stock of US gold. Confidence in convertibility could only erode as the ratio of foreign dollar claims to US gold widened.
That erosion played out through the 1960s. The London Gold Pool (1961–68) saw the US and seven European central banks coordinate sales into the open market to defend the $35 price against rising private demand. France, under President Charles de Gaulle, periodically redeemed dollar holdings for physical gold and repatriated reserves from New York and London, a pointed demonstration of the gap between paper dollar claims and the finite gold actually backing them. The Pool collapsed in March 1968, giving way to a two-tier system: a $35 official price for central-bank transactions and a separate, higher free-market price for everyone else.
The end came in August 1971, when President Nixon suspended dollar convertibility into gold entirely, the "Nixon Shock," closing the gold window and, with it, Bretton Woods. The Smithsonian Agreement that December tried to patch the system back together, devaluing the dollar and raising the official price to $38 per ounce. It did not hold. A second devaluation in February 1973 lifted the statutory price to $42.22. Within weeks, major currencies abandoned fixed rates altogether for a managed float. The free-market gold price, no longer tethered to any official commitment, began the permanent divergence from the statutory figure that continues today.
The 1976 Jamaica Accords made the break official: IMF members amended the Articles of Agreement to demonetize gold formally and legalize floating exchange rates, ending gold's role as the anchor of the international system. The $42.22 statutory price was never revisited. More than fifty years later it remains on Treasury's books, unrevised, while the market price has moved roughly a hundredfold.
market price
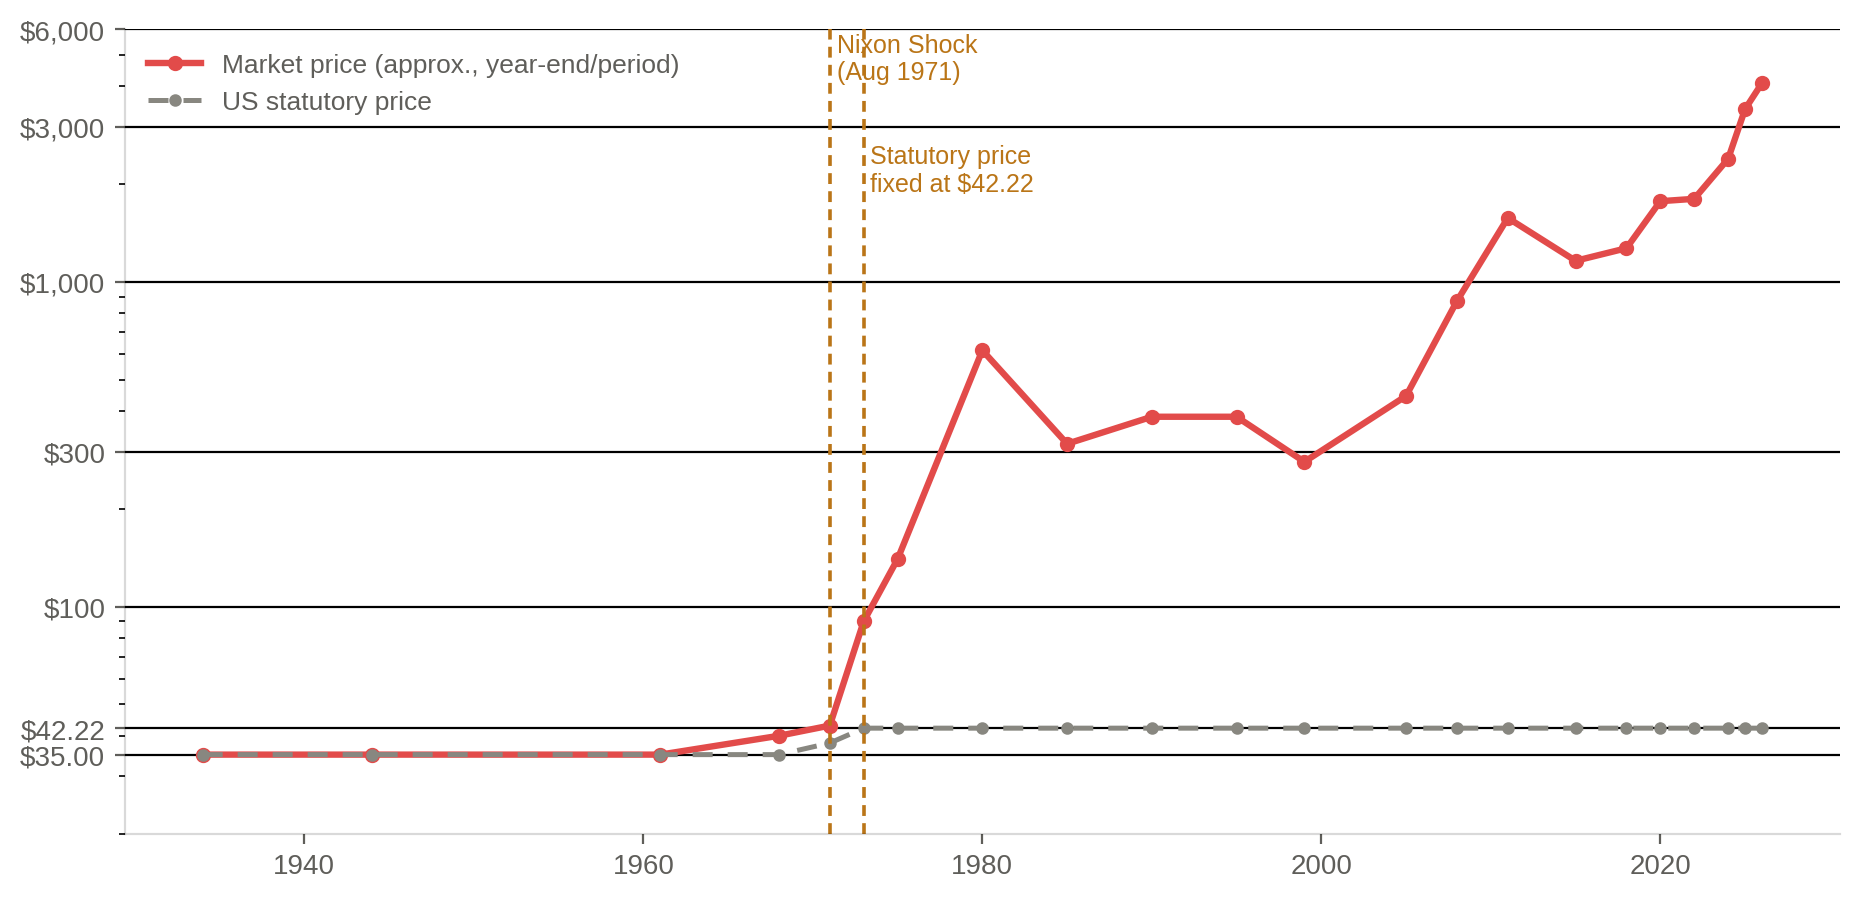
Editor’s note. Pre-1968 figures reflect the fixed official/Bretton Woods price, at which the market and statutory prices were the same by construction. Later market figures are approximate year averages, year-end levels, or notable peaks as labeled, not exact daily closes, and are compiled from public market histories rather than a single continuous dataset. Statutory prices and the dates of each devaluation are drawn from the historical record of the Gold Reserve Act, the Smithsonian Agreement, and the 1973 devaluation.
3Central Bank Gold Buying in the Post-2008 Era
For roughly two decades after the late 1970s, official-sector gold was a story of steady disposal, not accumulation. European central banks (Belgium, the Netherlands, Switzerland, and, most visibly, the United Kingdom) sold down reserves through the 1990s and early 2000s, a period whose low-water mark is still remembered in the UK as "Brown's Bottom": roughly half of Britain's gold reserves were sold between 1999 and 2002, near a twenty-year price low, under then-Chancellor Gordon Brown. The 1999 Washington Agreement on Gold (renewed and known later as the Central Bank Gold Agreement) organized European sales into an orderly, capped schedule specifically to prevent this kind of disposal from destabilizing the market further.
The 2008–09 Global Financial Crisis marks the inflection point. Central banks, led by emerging-market authorities, turned from net sellers to net buyers around 2009–10 and have stayed there ever since. Each successive renewal of the European sales agreement carried a smaller quota than the last, and its signatories stopped selling in any meaningful volume well before the agreement was allowed to lapse altogether in 2019.
Regulatory change reinforced the shift: as Basel III bank-capital rules phased in through the late 2010s, most implementing jurisdictions reclassified allocated physical gold as a Tier 1, zero-risk-weighted asset for commercial banks. That improved its regulatory treatment relative to many other reserve instruments and reinforced its appeal to institutions already inclined to hold it.
The most consequential single catalyst, though, was geopolitical rather than regulatory. The 2022 Russian invasion of Ukraine, and the subsequent freezing of an estimated $300 billion in Russian central-bank foreign-exchange reserves by the United States, the European Union, the United Kingdom, and allied governments, is widely cited by market participants and by central bankers themselves as the moment reserve diversification took on a political dimension. Reserve managers across China, India, Turkey, the Gulf states, and elsewhere have pointed to the episode as evidence that dollar- and euro-denominated reserve assets carry a confiscation risk that gold, held domestically or in allied vaults, does not.
The scale of the response has been unusual by historical standards: annual central-bank net gold purchases exceeded 1,000 tonnes in both 2022 and 2023, roughly double the average pace of the decade that preceded it7. China's own accumulation, detailed in Section 6, sits inside this broader cycle rather than apart from it: a hedge alongside dozens of other reserve managers making the same calculation, not a unilateral monetary maneuver.
4Lessons from the Plaza Accord and Its Aftermath
By the mid-1980s the dollar had appreciated roughly 50 percent on a trade-weighted basis since 1980, driven by Federal Reserve Chair Paul Volcker's disinflationary interest-rate regime and capital inflows chasing US yields. Combined with a widening US trade deficit and a swelling federal budget deficit under President Reagan (the so-called twin deficits), the overvalued dollar became a growing source of protectionist pressure in Congress and a central complaint of US exporters and manufacturers.
The 1985 Plaza Accord is the reference case for coordinated exchange-rate intervention that followed from that pressure. The US, Japan, West Germany, France, and the UK, the G5, intervened jointly to depreciate the dollar and achieved a substantial, rapid move. For Japan, the yen's roughly 40–50 percent appreciation over the following two years squeezed exporters. Tokyo answered with monetary easing and fiscal stimulus to prop up domestic demand.
That policy mix, layered on top of financial deregulation and structural features specific to Japan's economy, helped inflate equity and real-estate prices through the late 1980s. The bust that followed in the early 1990s left banks loaded with non-performing loans, forced years of balance-sheet repair across households and firms, and produced a prolonged stretch of low growth and mild deflation. Post-mortems point to a combination of factors: the external shock itself, the scale and duration of the domestic stimulus that followed, delayed cleanup of impaired banks, and the "zombification" of insolvent firms kept alive by continued lending.
The Louvre Accord: stopping the slide
By early 1987 the dollar's post-Plaza decline had gone further and faster than the G5 had intended. The February 1987 Louvre Accord, agreed by the finance ministers of what was by then the G6 (later G7), committed signatories to stabilize exchange rates around then-prevailing levels rather than push the dollar down further. The episode is a useful complement to Plaza: coordinated intervention can overshoot, and stabilizing a currency move can be as hard a coordination problem as engineering one in the first place. It also exposed the limits of announced target zones: market pressure continued to test the agreed range within months, and by October 1987 ("Black Monday") global equity markets were reacting to a different set of stresses that had little to do with currency policy. In practice, if not in name, it ended the era of high-profile coordinated G7 currency intervention.
For today's surplus economies, the transferable lessons are specific rather than general: rapid currency adjustment without a matching domestic productivity strategy is destabilizing; leaning on credit expansion to offset external demand weakness postpones rather than resolves the problem; and early recognition of financial impairment beats delay. Later episodes, including the Asian financial crisis a decade later, reinforce the same point: domestic institutions and gradual rebalancing toward consumption and investment matter more than the exchange-rate mechanism itself.
The read-across to US–China dynamics is limited by today's floating-rate regimes, the expanded toolkit of quantitative policy, and a starkly different geopolitical backdrop. Even so, Plaza and Louvre together are a caution against over-relying on exchange-rate instruments to fix bilateral imbalances, and a reminder that adjustment expectations need to be symmetric, and that coordination is as hard to stop as it is to start.
5A Short History of US–China Monetary Friction
China pegged the renminbi to the US dollar at roughly 8.28 from 1994, following a unification of its previous dual exchange-rate system, until July 2005, when the People's Bank of China moved to a managed float referencing a currency basket. Washington had long argued the peg was held artificially weak to subsidize Chinese exports; Beijing maintained it reflected legitimate development-stage capital controls.
China's 2001 accession to the World Trade Organization accelerated export-led growth and a corresponding buildup of foreign-exchange reserves, which peaked at roughly $4 trillion around 20148 before declining amid capital-outflow pressure and a more actively managed reserve strategy in the years that followed.
The "currency manipulator" designation became a recurring flashpoint in US politics from the 2000s onward. The US Treasury's semiannual foreign-exchange reports repeatedly considered, and repeatedly stopped short of, that formal designation for over two decades. That changed in August 2019, at the height of the US–China trade war, when Treasury named China a currency manipulator outright. The designation was reversed within months, folded into the Phase One trade agreement signed in January 2020.
In parallel, Beijing pursued renminbi internationalization on its own track: the currency's inclusion in the IMF's Special Drawing Rights basket took effect in October 2016, and China built parallel financial infrastructure, including the Cross-Border Interbank Payment System (CIPS) for renminbi clearing and Belt and Road-linked financing vehicles, partly as insurance against overreliance on dollar-denominated payment rails.
The 2018–19 tariff escalation showed how quickly bilateral friction could spill from trade into finance: threats to sell US Treasury holdings, currency-intervention accusations, and speculation about "financial decoupling" all surfaced during that period, even though neither government ultimately took the more drastic steps some commentators floated at the time.
Since 2022, the same reserve-diversification logic behind the central-bank gold cycle described in Section 3 has fed a broader de-dollarization narrative in Beijing and Moscow: growing local-currency trade settlement between China and Russia, expanded use of CIPS, and continued PBOC gold accumulation are best read as hedging behavior at the margin, not a coordinated attempt to displace the dollar's reserve-currency role, which remains structurally dominant by any measure of trade invoicing, reserve composition, or capital-market depth.
6US and Chinese Official Gold Positions
US holdings of an estimated 8,133 tonnes1 constitute the world's largest official gold stock. Carried at the statutory price of $42.22 per ounce2, that stock is booked at roughly $11.0 billion9, a small fraction of its market-price equivalent. The Gold Reserve Act framework described in Section 2 gives the executive branch legal authority to adjust the official price, potentially via new gold certificates issued to the Federal Reserve, the same mechanism used in 1934. Any revaluation would credit the resulting gain to Treasury, but the practical hurdle is managing market expectations, not the legal mechanics.
China's reported reserves of approximately 2,346 tonnes as of end-June 20264 reflect a sustained, multi-year accumulation program (twenty consecutive months of purchases as of that reading, part of the broader post-2008 buying cycle covered in Section 3) that has put China among the largest official holders globally. Gold still makes up less than 10 percent of China's total reserves5. The stated rationale is portfolio diversification and hedging against concentration risk, consistent with the broader trend among reserve managers. Independent analysts continue to debate whether China's actual holdings (including any unreported accumulation) exceed the official figure: the PBOC's 2015 disclosure that reserves had jumped overnight from a long-stated 1,054 tonnes to 1,658 tonnes is a standing reminder that official figures can lag actual accumulation by years. Policy engagement should work from verified official data and treat any gap as a separate, unresolved question.
| Parameter | United States | China |
|---|---|---|
| Reported official holdings | ~8,133 tonnes1 | ~2,346 tonnes, end-June 20264 |
| Accounting basis | Statutory price, $42.22/oz, fixed since 19732 | Reserve-management valuation (no fixed statutory price) |
| Approx. book value at statutory price | ~$11.0 billion9 | Not applicable |
| Gold as share of total reserves | Not a standard comparison (US reserves are not FX-denominated in the same way) | <10%5 |
| Legal / policy framework | Gold Reserve Act of 1934, as amended | PBOC reserve-management mandate |
gold holders
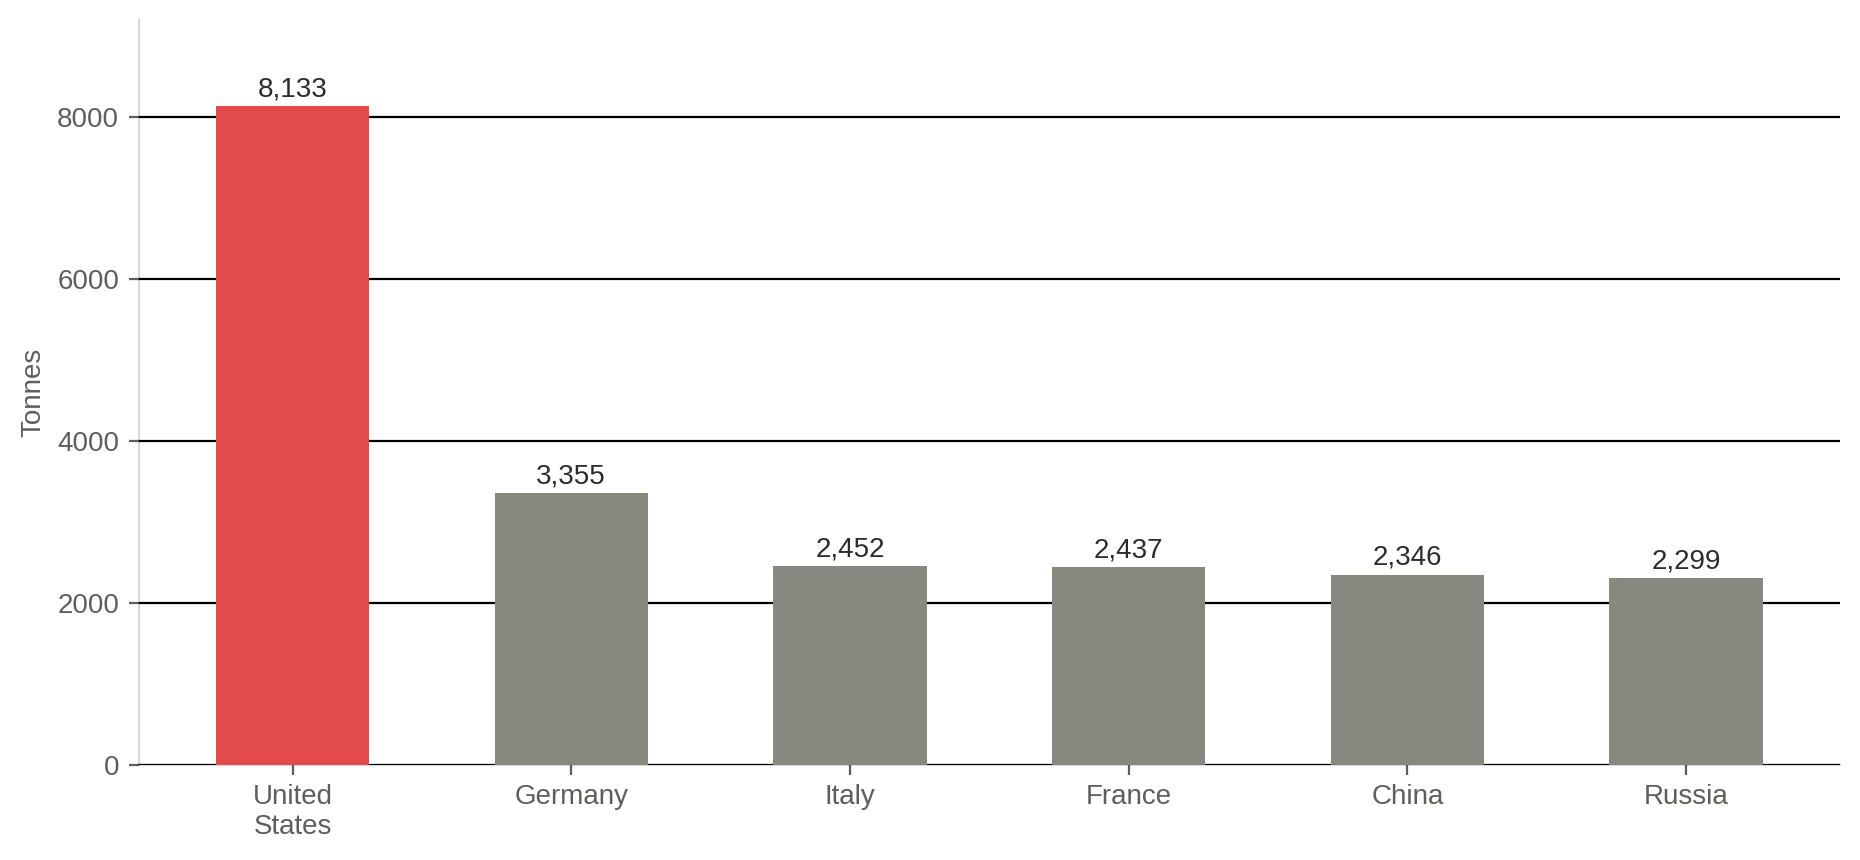
Editor’s note. Germany, Italy, France, and Russia figures are World Gold Council / IMF International Financial Statistics data, which is reported with a lag (most figures reflect year-end 2025). China's figure uses the PBOC's own more current monthly disclosure (end-June 2026) rather than the lagged IMF figure, so it is not perfectly comparable in timing to the other four. World total (~36,582 tonnes) and the top-6 share are Icarus Asia calculations from the same World Gold Council dataset.
build
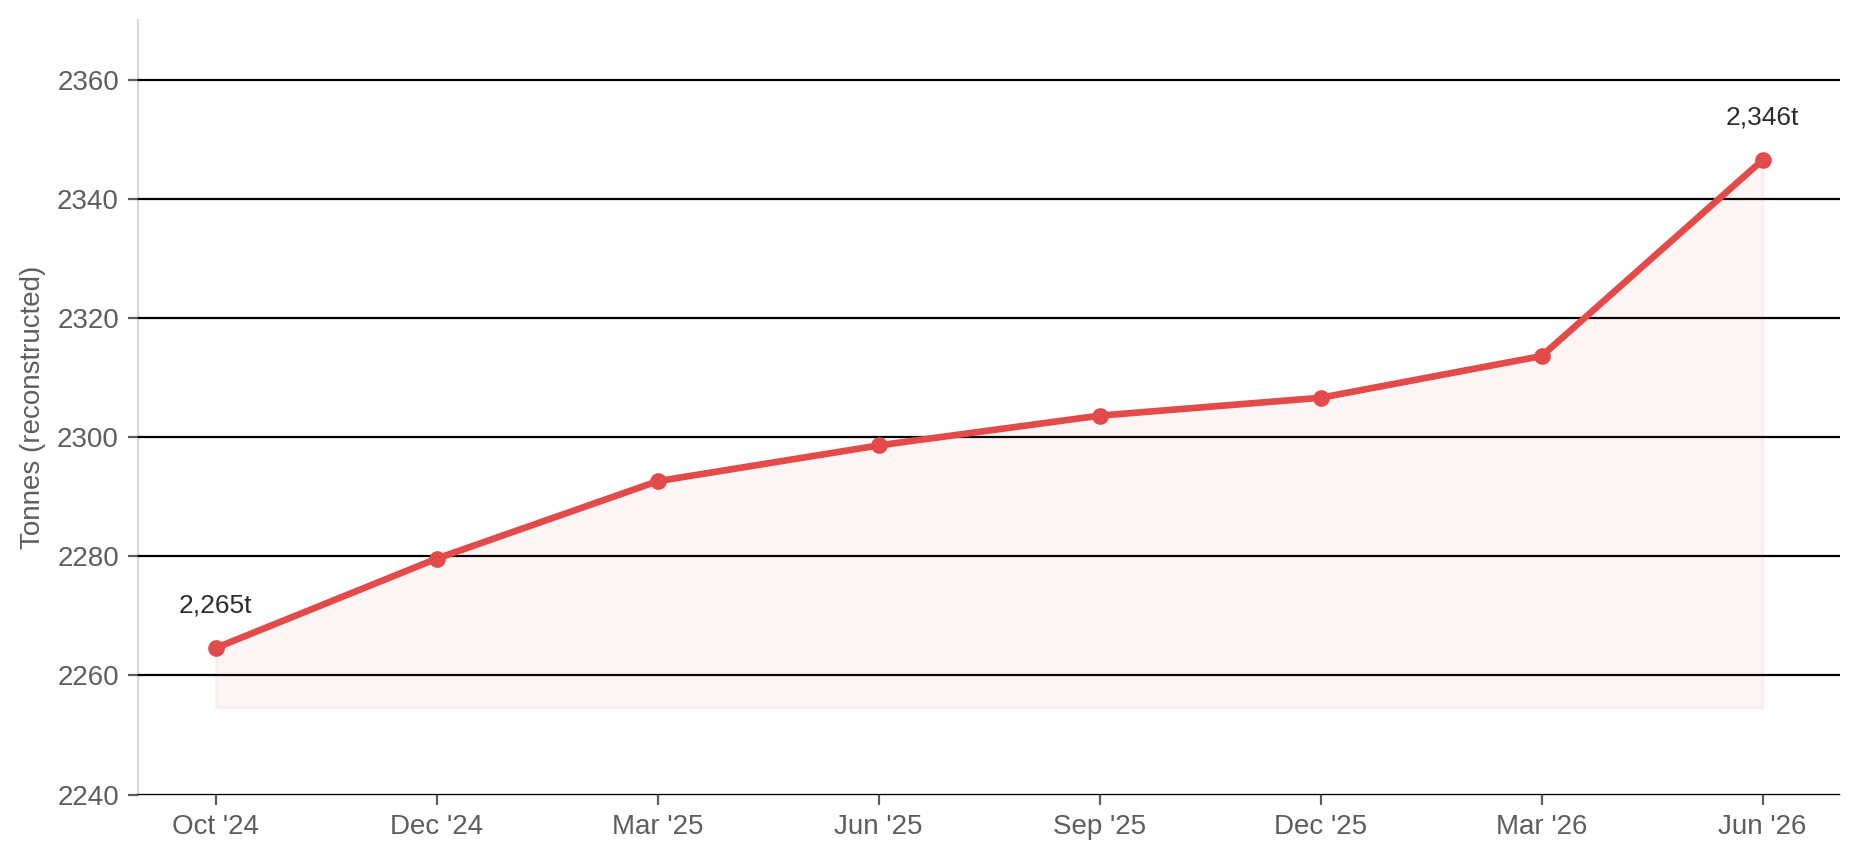
Editor’s note. No single primary source publishes a complete monthly series. This chart is an Icarus Asia reconstruction: the June 2026 and May 2026 levels are directly reported (PBOC via World Gold Council / Kitco News); earlier quarters are backed out by subtracting reported monthly additions in reverse from those two anchor points. Treat intermediate quarters as indicative, not official data points for that specific date.
Both positions confirm gold's role as insurance rather than active monetary base. China's continued accumulation and any US accounting revaluation are parallel, independent national decisions, not two moves in the same game.
7Balance-Sheet Effects of a US Gold Revaluation
Mechanically, a revaluation just updates the statutory price and books the resulting gain: no physical transaction occurs. Applying the exact conversion between reported tonnage and troy ounces to a range of illustrative price marks produces the estimates below3. Officials could apply that credit to debt management or other fiscal purposes, improving headline balance-sheet metrics without new issuance.
| Illustrative price | Total value at that price | Accounting gain vs. $42.22 basis | Notes |
|---|---|---|---|
| $2,500/oz | ~$653.7B | ~$642.7B3 | Below current spot; contained fiscal space, lower signaling risk |
| $3,000/oz | ~$784.4B | ~$773.4B3 | Below current spot |
| $3,500/oz | ~$915.2B | ~$904.1B3 | Near current spot (~$4,090, July 2026) |
| $4,000/oz | ~$1,045.9B | ~$1,034.9B3 | Just below current spot; larger optics gain, elevated risk markets misread the move |
revaluation gain
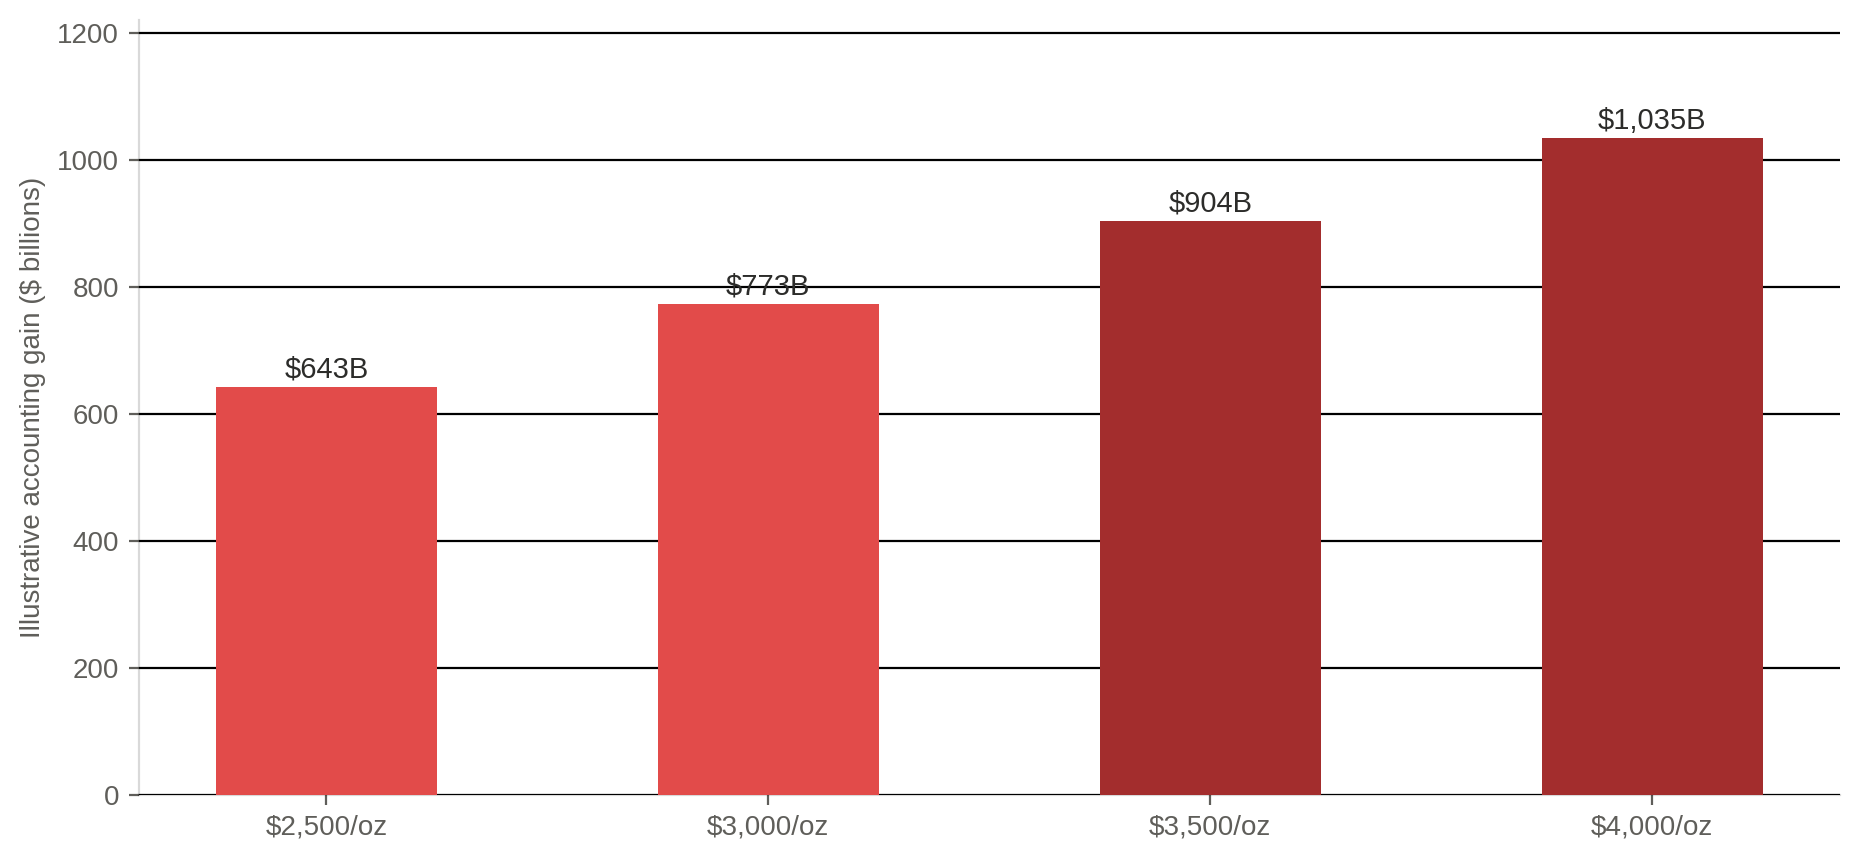
Editor’s note. Gains are exact arithmetic given the stated tonnage (8,133t × 32,150.75 troy oz/tonne) and each illustrative price, less the $42.22 statutory book value. The tonnage input itself is a rounded, approximate figure, so treat the outputs as indicative rather than to-the-dollar precise. Price scenarios are illustrative reference points, not forecasts of where gold will trade.
The limitations are structural, not incidental: a revaluation gain is a one-time accounting event. It does not change the underlying fiscal trajectory absent spending discipline, and it raises legitimate questions about Federal Reserve independence and credibility that need to be addressed before, not after, any announcement. The transmission channel here is optical and liquidity-related. It is not a substitute for structural fiscal reform.
8The Gold Certificate Ledger Mechanism
The statutory price is not a free-floating number Treasury can simply mark up in the abstract. It is wired directly into a specific, decades-old ledger relationship between the Treasury and the Federal Reserve. Under 31 U.S.C. § 5117(b), the Secretary of the Treasury may issue gold certificates against gold held in the Treasury, with total outstanding certificates capped at the dollar value of that gold at the statutory price, defined in the statute as "42 and two-ninths dollars" ($42.2222) per fine troy ounce13. Treasury does not sell gold to the Federal Reserve. Issuing a certificate is a book-entry claim, backed by Treasury's gold stock, that the Federal Reserve Banks carry as an asset.
As of the most recent weekly H.4.1 statistical release, the Federal Reserve's consolidated Gold Certificate Account stood at approximately $11.041 billion, and the Federal Reserve Bank of New York, acting as Treasury's fiscal agent, is the operational node that issues and redeems these certificates on the System's behalf14. That figure is consistent, to within rounding, with this report's own calculation of the book value of the US gold stock at the statutory price (Note 9).
If the Secretary raises the statutory price, the ceiling on outstanding certificates rises with it, since that ceiling is defined as tonnage multiplied by price. Treasury would then issue new certificates to the Federal Reserve Banks equal to the incremental dollar value between the old and new statutory figure. Mechanically, three things happen at once. Treasury's gold holdings are unchanged in tonnage but rise in recorded dollar value. The Federal Reserve's Gold Certificate Account, an asset, rises by the same incremental amount. And the Treasury General Account (TGA), the Federal Reserve's corresponding liability to Treasury, is credited by that same amount. No open-market operation, bond issuance, or new borrowing is required, and the entry nets to zero on the Federal Reserve's own balance sheet: assets and liabilities rise together.
From a consolidated federal government view (Treasury and the Federal Reserve combined), the transaction is closer to an internal transfer than to new wealth creation. It converts a dormant, unrealized valuation gain already sitting on the government's books into a spendable cash balance, without moving any physical metal or requiring a new congressional appropriation. That is what makes it attractive as a balance-sheet exercise, and exactly why its downstream effects need separate management (Section 9). None of this amounts to a return to convertibility or a gold standard: the certificates are not redeemable by the public for gold, and the transaction is confined to an internal ledger entry between two federal balance sheets.
9Inflationary Neutralization and Sterilization
Crediting the Treasury General Account with a large, one-off sum does not by itself expand the money supply or bank reserves. The TGA is a Treasury deposit liability on the Federal Reserve's balance sheet, separate from the reserve balances depository institutions hold at the Fed. A dollar sitting in the TGA sits outside the banking system's usable reserves.
The transmission channel is spending, not crediting. The liquidity effect arises only once Treasury draws down the enlarged TGA balance: every dollar spent, whether on debt paydown or program outlays, flows into private-sector bank accounts and shows up as new reserves at the Fed. Markets have already watched a smaller version of this dynamic play out around debt-ceiling episodes, where a falling TGA balance added to reserves and a post-ceiling TGA rebuild drained them.
If the Federal Reserve judged that a rapid drawdown following a large revaluation risked pushing reserve levels high enough to press short-term rates down, the standard toolkit applies: raise the rate paid on reserve balances (IORB) and the overnight reverse repo (ON RRP) rate to keep the effective funds rate anchored, or shrink the System Open Market Account portfolio faster to offset the added reserves elsewhere. None of these tools would be novel. They are the instruments the Fed already uses to manage ordinary TGA volatility, scaled to a larger one-off event.
Treasury could also sidestep the question entirely by not spending the credited balance, treating it as a cash buffer against the debt limit in the same way its existing cash balance and "extraordinary measures" already function during debt-ceiling standoffs. That approach captures the balance-sheet optics of a revaluation with none of the reserve-expansion risk, at the cost of realizing no incremental fiscal capacity. Whether a revaluation is inflationary in practice therefore depends on what Treasury does with the proceeds, not on the revaluation itself: proceeds banked as headroom are monetarily neutral by construction, and proceeds spent are, mechanically, no different from any other debt-financed fiscal expansion15.
10Impact on NDF and Derivatives Markets
The statutory price plays no direct role in how gold derivatives are priced. Futures, forwards, and options on gold are priced off the continuously traded spot and futures markets (COMEX, the London bullion market) using standard cost-of-carry models built from the spot price, prevailing interest rates, and gold lease rates. No market participant transacts gold with Treasury at the statutory price, so a change to that internal accounting figure does not enter any derivative pricing formula directly.
Where a revaluation could matter to derivatives markets is indirect. If traders read the announcement as new information about US fiscal credibility or official-sector gold demand, that reaction would move the spot price itself, and every derivative priced off spot would reprice accordingly, through the same signaling channel already described in Sections 7 and 12, not through any direct link to the statutory number.
Non-deliverable forwards exist because certain currencies, the renminbi among them, alongside the rupee, the won, and others, are not freely convertible or deliverable offshore. An NDF settles the difference between a contracted forward rate and a reference spot rate in US dollars. Gold enters this picture through the reserve-management channel: a central bank holding gold as a partial hedge against its own currency's depreciation is running a cross-asset hedge, betting gold (priced in dollars) holds or gains value if its own currency weakens against the dollar.
That hedge carries basis risk whenever gold moves for reasons unrelated to the specific depreciation risk being hedged. A US statutory revaluation is a clean example: it is a bookkeeping event with no fundamental link to renminbi or rupee depreciation pressure, so any spot-gold reaction it triggers would move the hedge asset without a matching move in the exposure it is meant to offset, at least in the window before markets settle on how, if at all, to interpret the event. No directly comparable episode exists in the modern floating-rate era to calibrate the size or duration of this effect, so this assessment is necessarily analytical rather than empirical16.
11Institutional Readiness Matrix
Execution of a revaluation runs through a small number of institutional nodes, each with a distinct, largely mechanical role17.
| Node | Primary responsibility | Key mechanism / tool | Illustrative timing |
|---|---|---|---|
| US Treasury, Bureau of the Fiscal Service | Administers the Gold Certificate Fund; calculates the incremental certificate value owed to the Federal Reserve following any statutory price change | Statutory recordkeeping under 31 U.S.C. § 5117 | Immediate, upon Secretarial determination |
| Federal Reserve Bank of New York (fiscal agent) | Executes book-entry issuance of new gold certificates; credits the Treasury General Account | Gold Certificate Account adjustment; TGA credit entry on the H.4.1 statement | Same-day book entry |
| Federal Reserve Board, Division of Monetary Affairs | Assesses reserve and rate implications; selects sterilization tools if TGA drawdown risks reserve or rate pressure | IORB and ON RRP rate settings; SOMA portfolio operations | Ongoing, contingent on Treasury's spending decisions |
| US Treasury, Office of Debt Management | Decides whether and how to apply the TGA credit: debt paydown, cash buffer, or appropriated spending | Debt-issuance calendar adjustments; cash-balance policy | Medium-term, budget-cycle dependent |
| PBOC / State Council reserve-planning teams | Monitor the US action for signaling content; assess implications for China's own reserve-accounting practice and gold-purchase pace | Internal reserve-accounting review; potential adjustment to PBOC's monthly purchase cadence | Reactive, likely weeks to months |
China's likely response is directional judgment, not confirmed policy: the PBOC does not pre-announce its reaction function, and any adjustment would surface only in subsequent monthly reserve disclosures.
12Policy Risks: Stealth Devaluation and Physical-Market Liquidity
Because the only two prior changes to the US statutory gold price, in 1934 and 1973, were both explicit dollar devaluations relative to gold under fixed or quasi-fixed exchange-rate regimes, any renewed change carries that history with it. Today's floating-rate system means there is no exchange peg left to devalue, but foreign officials, rating agencies, and bond investors could still read a revaluation as an implicit signal about US fiscal stress or a diminished commitment to dollar stability, precedent aside from present-day mechanics. That perception risk is real, and it needs to be managed through explicit, advance communication rather than left to be inferred after the fact.
If that reading takes hold, the more plausible market response is a gradual repricing: incrementally higher term premia on long-dated Treasuries, somewhat faster reserve diversification by foreign official holders, rather than a discrete shock. Gold represents a small share of most reserve managers' portfolios, and a statutory price change does not alter the terms of any actual outstanding US Treasury security.
On the specific concern that commercial banks could arbitrage the gap between a new statutory price and the market price: that channel does not exist under current law. Treasury does not sell gold to, or buy gold from, commercial banks or the public at the statutory price. The figure exists solely for the internal Treasury-Federal Reserve ledger transaction described in Section 8, and there is no legal window through which a bank could buy gold from Treasury at $42.22, or any revised figure, and resell it at the market price.
The more plausible physical-market risk runs a different course. If a revaluation is read as a strong bullish signal for gold generally, it could accelerate an existing private-market dynamic: a rush to convert paper gold claims (unallocated positions, ETF shares, futures contracts) into allocated physical bars, straining vault and delivery capacity at COMEX and in London. A dislocation between COMEX futures and London spot pricing in March and April 2020, driven by pandemic-era delivery and logistics disruption rather than any change in official-sector holdings, is the closest real-world illustration of how quickly physical-delivery stress can appear18. Any sequencing plan for a revaluation should treat this physical-market liquidity channel, not a nonexistent statutory arbitrage, as the operationally relevant tail risk.
13Feasible Areas for US–China Monetary Dialogue
The realistic scope for cooperation is technical and operational, not architectural. FX volatility containment is one candidate: dialogue on market functioning and shared practices for managing large, fast capital flows. Swap lines and liquidity facilities are another, building on existing arrangements to explore gold-collateralized or gold-benchmarked crisis-liquidity options under strict protocols. Reserve managers could also share more on transparency, through selective information-sharing via BIS or IMF channels that respects national-security constraints on both sides. Crisis protocols round out the list: joint scenario exercises on how stress transmits across the two economies' financial systems.
This agenda is deliberately unambitious. Multilateral venues reduce the bilateral political sensitivity that would sink the same proposals if negotiated directly, much as the G5/G7 process did during Plaza and Louvre, and as BIS and IMF working groups do today.
14Risks, Constraints, and Scenario Analysis
Base case
Modest technical exchanges produce marginal gains in mutual understanding and volatility management. No headline announcements; progress is incremental and largely invisible to markets.
Upside case
Sustained dialogue improves contingency readiness and contributes to a smoother macro adjustment path on both sides over a multi-year horizon.
Timeline and magnitude are directional judgment, not a modeled forecast12.
Tail risks
Markets misinterpret a US revaluation or a policy statement, triggering capital shifts or accelerated reserve diversification; domestic political backlash halts progress in either country; other governments pursue competitive revaluations of their own gold holdings.
Probability is not quantified here; treat this as a qualitative risk register, not a forecast.
Political-economy constraints bind harder than the technical mechanics. The main systemic risk is not the revaluation itself but the possibility that other governments read it as a precedent and respond in kind, or that reserve managers globally shift expectations about the dollar's relationship to gold. That is the same dynamic, in miniature, that made the Triffin dilemma and the eventual collapse of Bretton Woods a confidence problem rather than a purely technical one.
15Policy Pathways and Sequencing
Phase 1 (6–18 months). Stand up or make use of existing technical working groups on reserve accounting and FX monitoring: the same small-group, technical-staff model that made Plaza and Louvre workable, rather than a leaders-level negotiation. In parallel, the US runs internal modeling of revaluation options while China continues its accumulation program alongside domestic financial-system strengthening.
Phase 2 (medium-term). Explore expanded liquidity tools and shared volatility-management principles; extend reporting through multilateral channels.
Phase 3 (longer horizon). Joint research on balance-sheet resilience through the IMF and BIS, with periodic high-level stocktakes.
Every phase is designed to be reversible, and domestic policy retains primacy throughout. Sequencing exists to allow testing and recalibration, not to lock in commitments neither side can unwind.
16Conclusion and Recommendations
Gold accounting mechanics and fifty years of monetary history will not settle US–China monetary frictions on their own. What they offer instead is a narrow, real opportunity for risk management within the existing system.
- United States: Complete internal technical analysis of revaluation options ahead of any decision; pursue low-stakes dialogue that emphasizes continuity with the existing framework rather than change.
- China: Continue prioritizing domestic financial-system resilience and transparent reserve reporting; engage selectively on operational stability tools without conceding ground on reserve strategy.
- Multilateral bodies (IMF, BIS, G20): Provide technical forums and scenario work that depoliticize the issue and keep information exchange moving even when bilateral talks stall.
Executed with mutual restraint, this narrower agenda has real option value for global monetary stability, without requiring either country to alter the core architecture of its monetary arrangements.
Notes & Sources
Every figure carrying a superscript in the text above is sourced or explained below. Estimates and reconstructions are labeled as such; readers relying on this analysis for decision-making should independently verify current gold prices and reserve figures at the time of use, since both move continuously.
- World Gold Council, "Gold Reserves by Country" (IMF International Financial Statistics data). Source for the US official gold reserve figure (~8,133 tonnes), cited in the Executive Summary, Section 6, and Figure 2. ↩
- 31 U.S.C. § 5116 (Gold Reserve Act framework); U.S. Treasury Fiscal Data, "Status Report of U.S. Government Gold Reserve." Source for the $42.22/oz statutory price, fixed since the 1973 devaluation, cited in the Executive Summary and Section 6. ↩
- Icarus Asia calculation. Illustrative revaluation accounting gains (Executive Summary, Section 7, Figure 4) are computed by multiplying the reported US tonnage (Note 1) by the exact troy-ounce conversion factor (32,150.75 oz/tonne) at each illustrative price, less the $42.22 statutory book value. Tonnage is an approximate, rounded input; gain figures move with any change to that assumption. These are not forecasts of future gold prices. ↩
- People's Bank of China monthly reserve disclosures, as reported by World Gold Council (Ray Jia, "China gold market update" series), Kitco News, and Bloomberg. Source for China's official reserves (~2,346 tonnes, end-June 2026) and its twenty-consecutive-month purchase streak, cited in the Executive Summary, Section 6, and Figure 3. ↩
- World Gold Council. Source for gold as a share of China's total reserves (<10%), cited in the Executive Summary and Section 6. ↩
- Icarus Asia compilation (Figure 1), drawn from public market histories including USAGold's gold price history archive, World Gold Council Gold Hub price data, and Federal Reserve historical statistics on the Bretton Woods and post-Bretton Woods periods. Figures are approximate annual averages, year-end levels, or notable peaks as labeled, not a precise continuous series. ↩
- World Gold Council, Gold Demand Trends reports. Source for annual central-bank net gold purchases exceeding 1,000 tonnes in 2022 and 2023, cited in Section 3. Figures are approximate and rounded. ↩
- State Administration of Foreign Exchange (SAFE) / PBOC reserve data, as widely reported. Source for China's foreign-exchange reserves peaking at roughly $4 trillion around 2014, cited in Section 5. Figure is a commonly cited approximation, not an exact year-end figure. ↩
- Icarus Asia calculation. US book value at the statutory price (~$11.0 billion), derived from Notes 1 and 2, cited in Section 6 and Figure 4. ↩
- World Gold Council, "Gold Reserves by Country," supplemented with the PBOC's more current monthly disclosure for China (Note 4). Source for the top-six holder comparison in Figure 2. The world total (~36,582 tonnes) and top-six share (~55%) are Icarus Asia calculations from the same dataset. ↩
- Icarus Asia reconstruction (Figure 3), backed out from cumulative monthly PBOC purchase disclosures reported across World Gold Council, Kitco News, Bloomberg, and TradingView/Reuters coverage between November 2024 and June 2026. No single primary source publishes the complete monthly series; intermediate quarters are indicative, not official data points. ↩
- Icarus Asia: directional analytical judgment, not a modeled probability, timeline, or forecast. Cited in Section 14. ↩
- 31 U.S.C. § 5117(b) (Gold Reserve Act framework, gold certificate authority). Source for the statutory mechanics of gold certificate issuance and the "42 and two-ninths dollars" valuation cap, cited in Section 8. ↩
- Federal Reserve H.4.1, "Factors Affecting Reserve Balances," Gold Certificate Account line item (~$11.041 billion, week ended June 24, 2026); Federal Reserve Bank of New York's role as fiscal agent, per Federal Reserve public guidance. Cited in Section 8. ↩
- Icarus Asia analysis. The sterilization discussion in Section 9 applies standard, well-documented Federal Reserve balance-sheet mechanics (TGA, IORB, ON RRP, SOMA operations) to a hypothetical revaluation scenario with no modern precedent. Treat it as an analytical framework, not a forecast of how the Fed would in fact respond. ↩
- Icarus Asia analysis. The NDF and derivatives-market assessment in Section 10 is analytical rather than empirical: no US statutory gold revaluation has occurred in the modern floating-rate, NDF-market era, so there is no historical episode to calibrate the size or duration of any basis-risk effect. ↩
- Icarus Asia analysis. The Institutional Readiness Matrix in Section 11 is Icarus Asia's own mapping of likely execution responsibilities based on statutory authority and existing Federal Reserve operational roles. It is not official guidance from Treasury, the Federal Reserve, or the PBOC, and the PBOC row in particular is directional judgment about a likely reaction, not a confirmed policy. ↩
- Widely reported market event. The COMEX-London gold price dislocation of March–April 2020, driven by pandemic-era refinery and logistics disruption, cited in Section 12 as an illustrative, unrelated-cause analog for physical-delivery stress, not evidence of any connection to a statutory gold revaluation. ↩