
Millions of American Workers Will Need New Jobs by 2035.
The McKinsey Global Institute estimates the country could add more jobs than automation removes. About 11 million workers would have to change occupations to fill them, and only one in seven has a direct route.
By 2035, automation could remove the equivalent of 36 million jobs from the American economy. An aging population, a wave of construction and energy investment, and the buildout of data centers could create demand for more than 40 million.
That is a net gain of about five million jobs, and it is the good news in a report the McKinsey Global Institute published this month. The rest of the 82 pages is about the catch. Roughly 11 million workers, about 7 percent of current employees, would have to move into a different occupation to fill the openings. Only about one in seven of them has a direct route to a growing job, meaning one that takes limited retraining and costs no pay. Nearly half face what the institute calls an unpaved pathway: large skill gaps, lower wages, extra credentials, or some mix of the three.
The institute's estimates come from a model. Its first endnote says so: “These are model outputs under a base set of assumptions, not measurements of observed change.”
The hours go faster than the jobs
The institute estimates that automation technologies could absorb about 54 percent of current work hours by 2035. That does not mean 54 percent fewer jobs. It expects organizational and market forces to offset about 60 percent of the effect, which leaves a reduction in labor demand equal to about 21 percent of current hours. That is the 36 million.
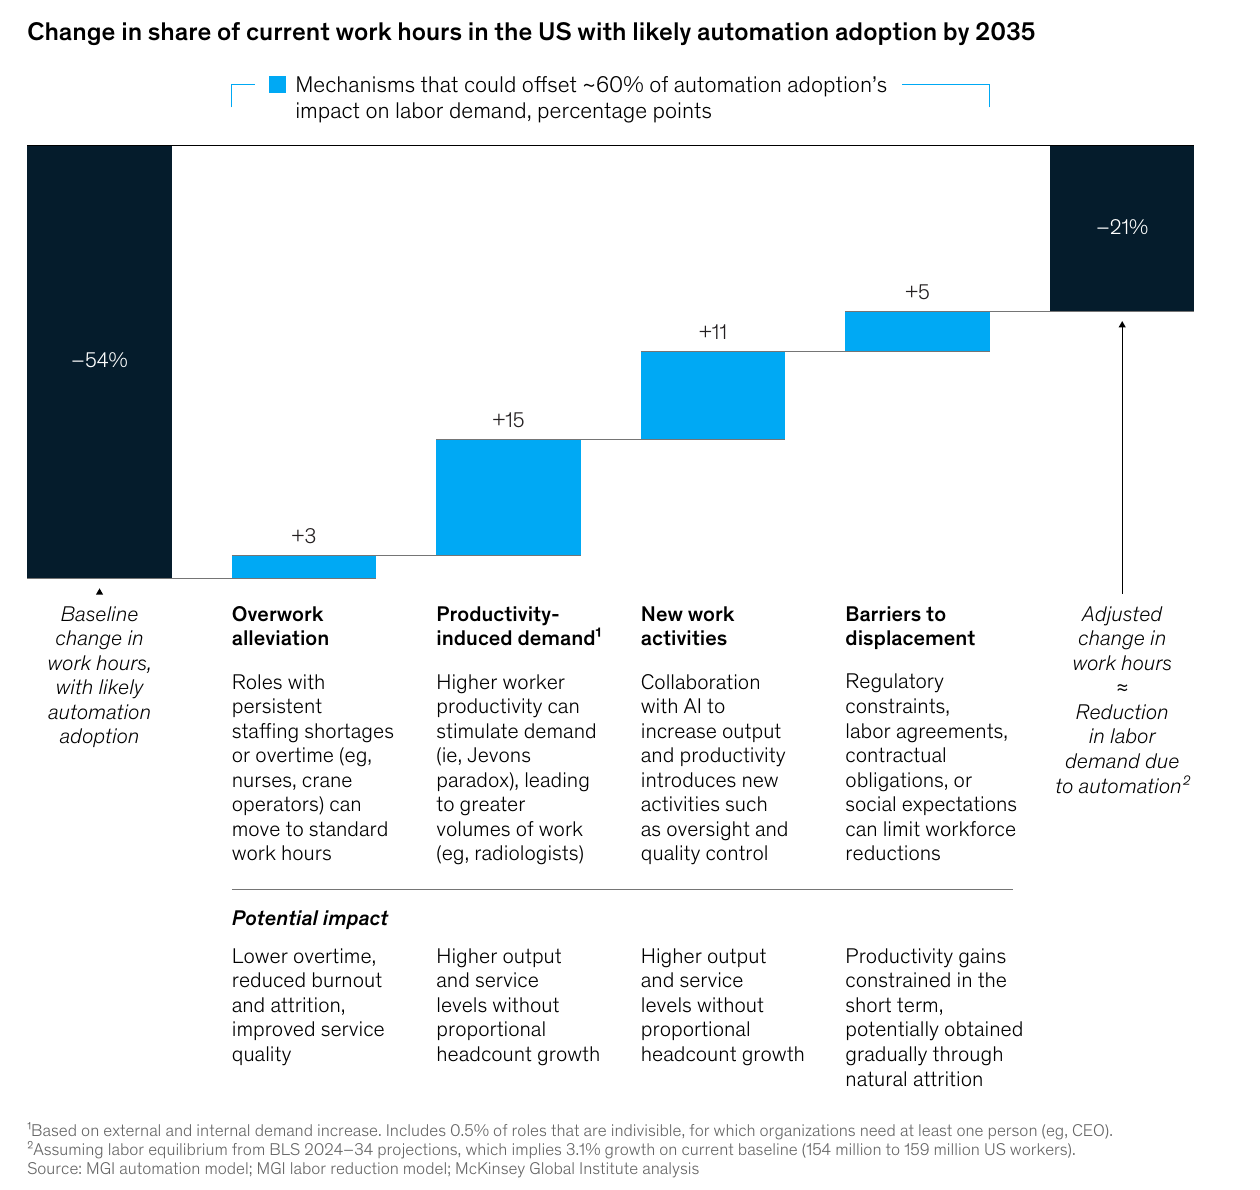
Four kinds of offset do the work, and one of them does most of it. Productivity gains can lower costs or raise quality and so increase demand for the same service, a pattern known as the Jevons paradox. The report puts that at 15 percentage points of the 54. It cites a study that found employment of auditors rose 4.3 percent after the adoption of AI, with audit quality improving too. New tasks tied to the machines, such as reviewing their output and handling exceptions, offset 11 points. Barriers to displacement, among them regulation and labor agreements, offset five. Relief for overworked staff in fields like nursing and crane operation accounts for three.
Adoption will be lopsided. The report expects average adoption to reach roughly 80 percent of current hours in office and administrative support by 2035, 70 percent in technology and analytics and 68 percent in retail and sales. Healthcare professionals come in at 26 percent, public safety and security at 28. The spread inside a single group can be wide. For office and administrative roles, expected adoption runs from roughly 48 percent of hours to 96 percent.
“Technology determines what is possible, but managerial choices determine how quickly those possibilities become reality.”McKinsey Global Institute
Most of the growth has little to do with AI
The 41 million jobs come mostly from forces the report places outside the technology. Its own heading says macroeconomic forces “will shape labor demand as much as or more than AI.” Rising living standards account for roughly 18 million jobs, as households and firms buy more services and hire for management, hospitality, personal services and other coordination-intensive work. Aging adds another eight million net, in long-term care, chronic and specialty care and home-based support. Construction adds about three million full-time equivalents and the energy buildout two million more. Software, cloud computing and streaming add about three million, and the data centers and semiconductor plants behind them another two million.
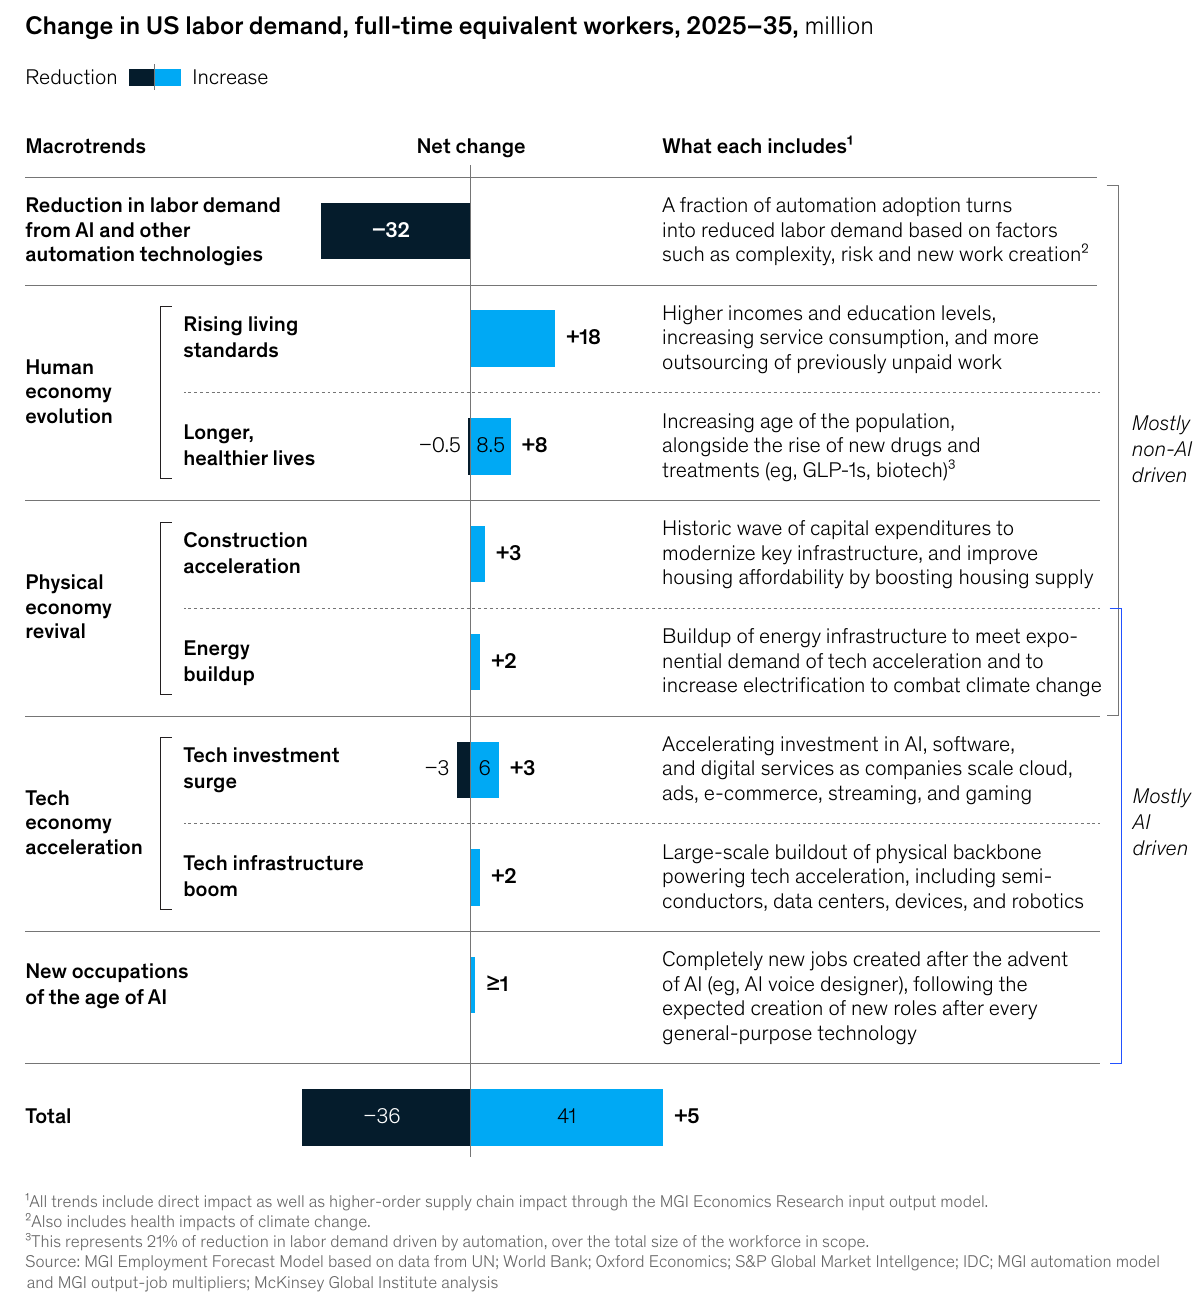
The institute assumes total employment grows about 3.1 percent over the decade, from 154 million to 159 million, in line with Bureau of Labor Statistics projections. Its model asks how that total gets redistributed. The United States, it says, is likely to have more jobs in 2035 than today but fewer workers, because the population is aging.
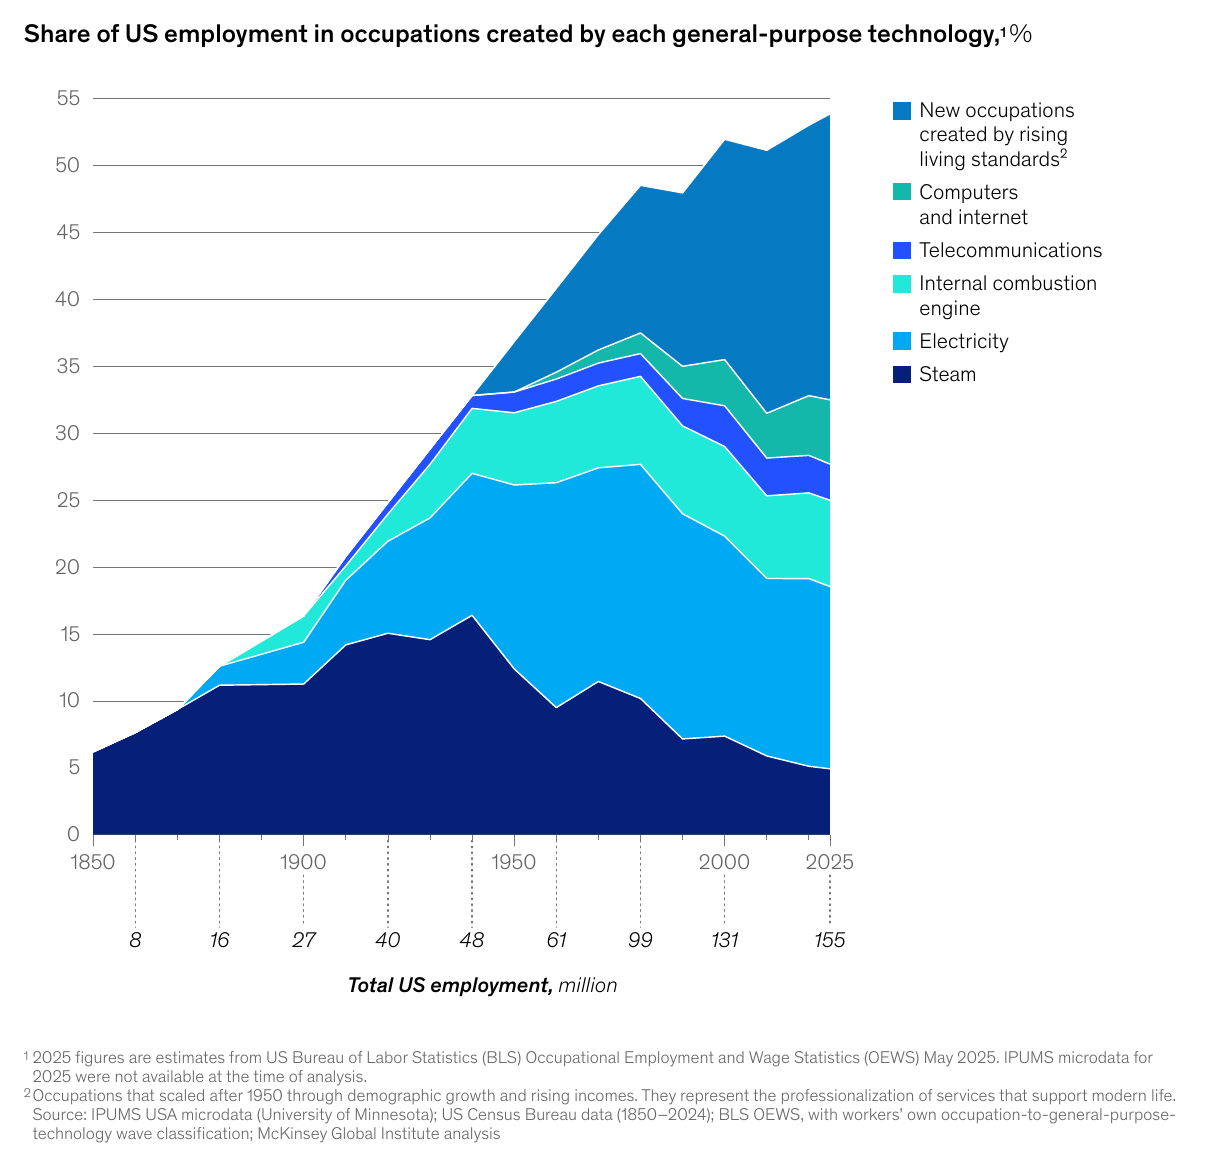
AI's own contribution to new work is the least certain piece. Occupations created by earlier general-purpose technologies, from steam to computers, account for about a third of US employment today, and occupations that emerged as incomes rose account for more than one-fifth. In 1920, roughly one in four American workers was employed in agriculture. Farming is now under 2 percent of employment. Applying the historical rate at which such technologies produced new occupations, the institute estimates AI could create 500,000 to two million jobs in occupations that do not yet exist or are too small to measure.
Eleven million people, and a decade to move them
Of the 36 million jobs lost to falling demand, the institute expects 25 million to be offset by growth inside the same occupations. That leaves 11 million workers whose occupations shrink with nowhere to go inside them, and 16 million new openings elsewhere that same-occupation growth cannot fill. The five-million difference would go to new entrants: students, migrants and people returning to work.
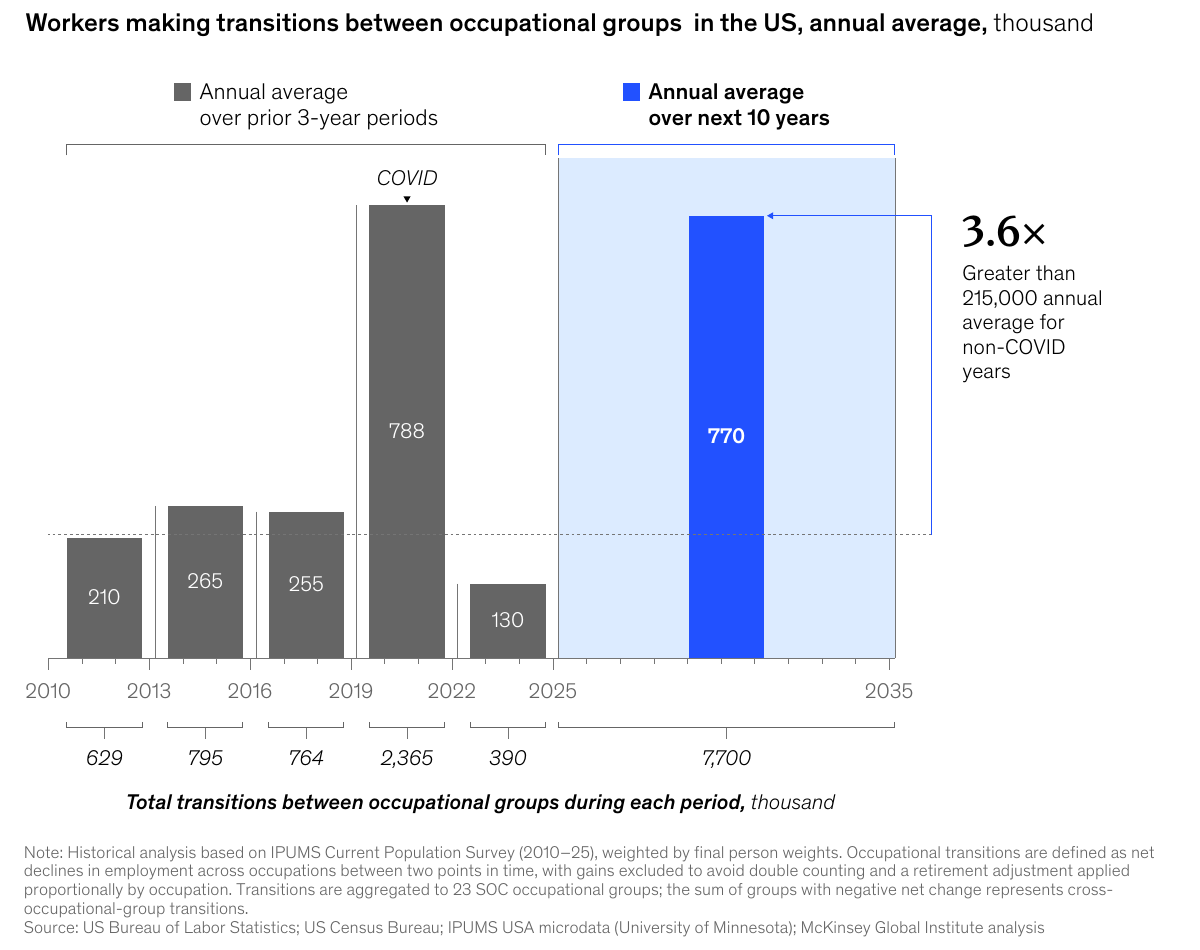
The change in where people move matters more than the count. Transitions have historically happened within broad occupational groups that call for similar skills, or within a single occupation. This time they would cross groups. About 770,000 workers a year would have to switch occupational groups, roughly 3.6 times the historical average of 215,000 in non-pandemic years. The pandemic supplies a comparison: about 788,000 workers a year changed occupational groups from 2019 to 2022. The difference, the report says, is duration. “A two- to three-year shock is one thing; a decade-long one is another.”
Workers today also move less from one employer to another than they did in the late 1990s and early 2000s, the report notes, pandemic surge aside.
Timing is its own risk. If automation outpaces demand growth, the report says, displacement can happen before the offsetting jobs exist. Software development is its example: demand for developers fell sharply from its 2022 peak, partly as companies corrected pandemic-era overhiring and partly because AI automated coding tasks. Since early 2025, postings for developers have risen about 15 percent, with the openings concentrated in senior and AI-oriented roles.
“Jobs may be plentiful, while direct pathways to them may not.”McKinsey Global Institute
A short list of occupations carries the decline
More than 75 percent of the full-time equivalents who may need to change occupations work in three of the 22 occupational groups: office and administrative support, retail and sales, and transportation and logistics. More than a third are in five occupations: customer service representatives, retail sales associates, office assistants, cashiers and warehouse workers.
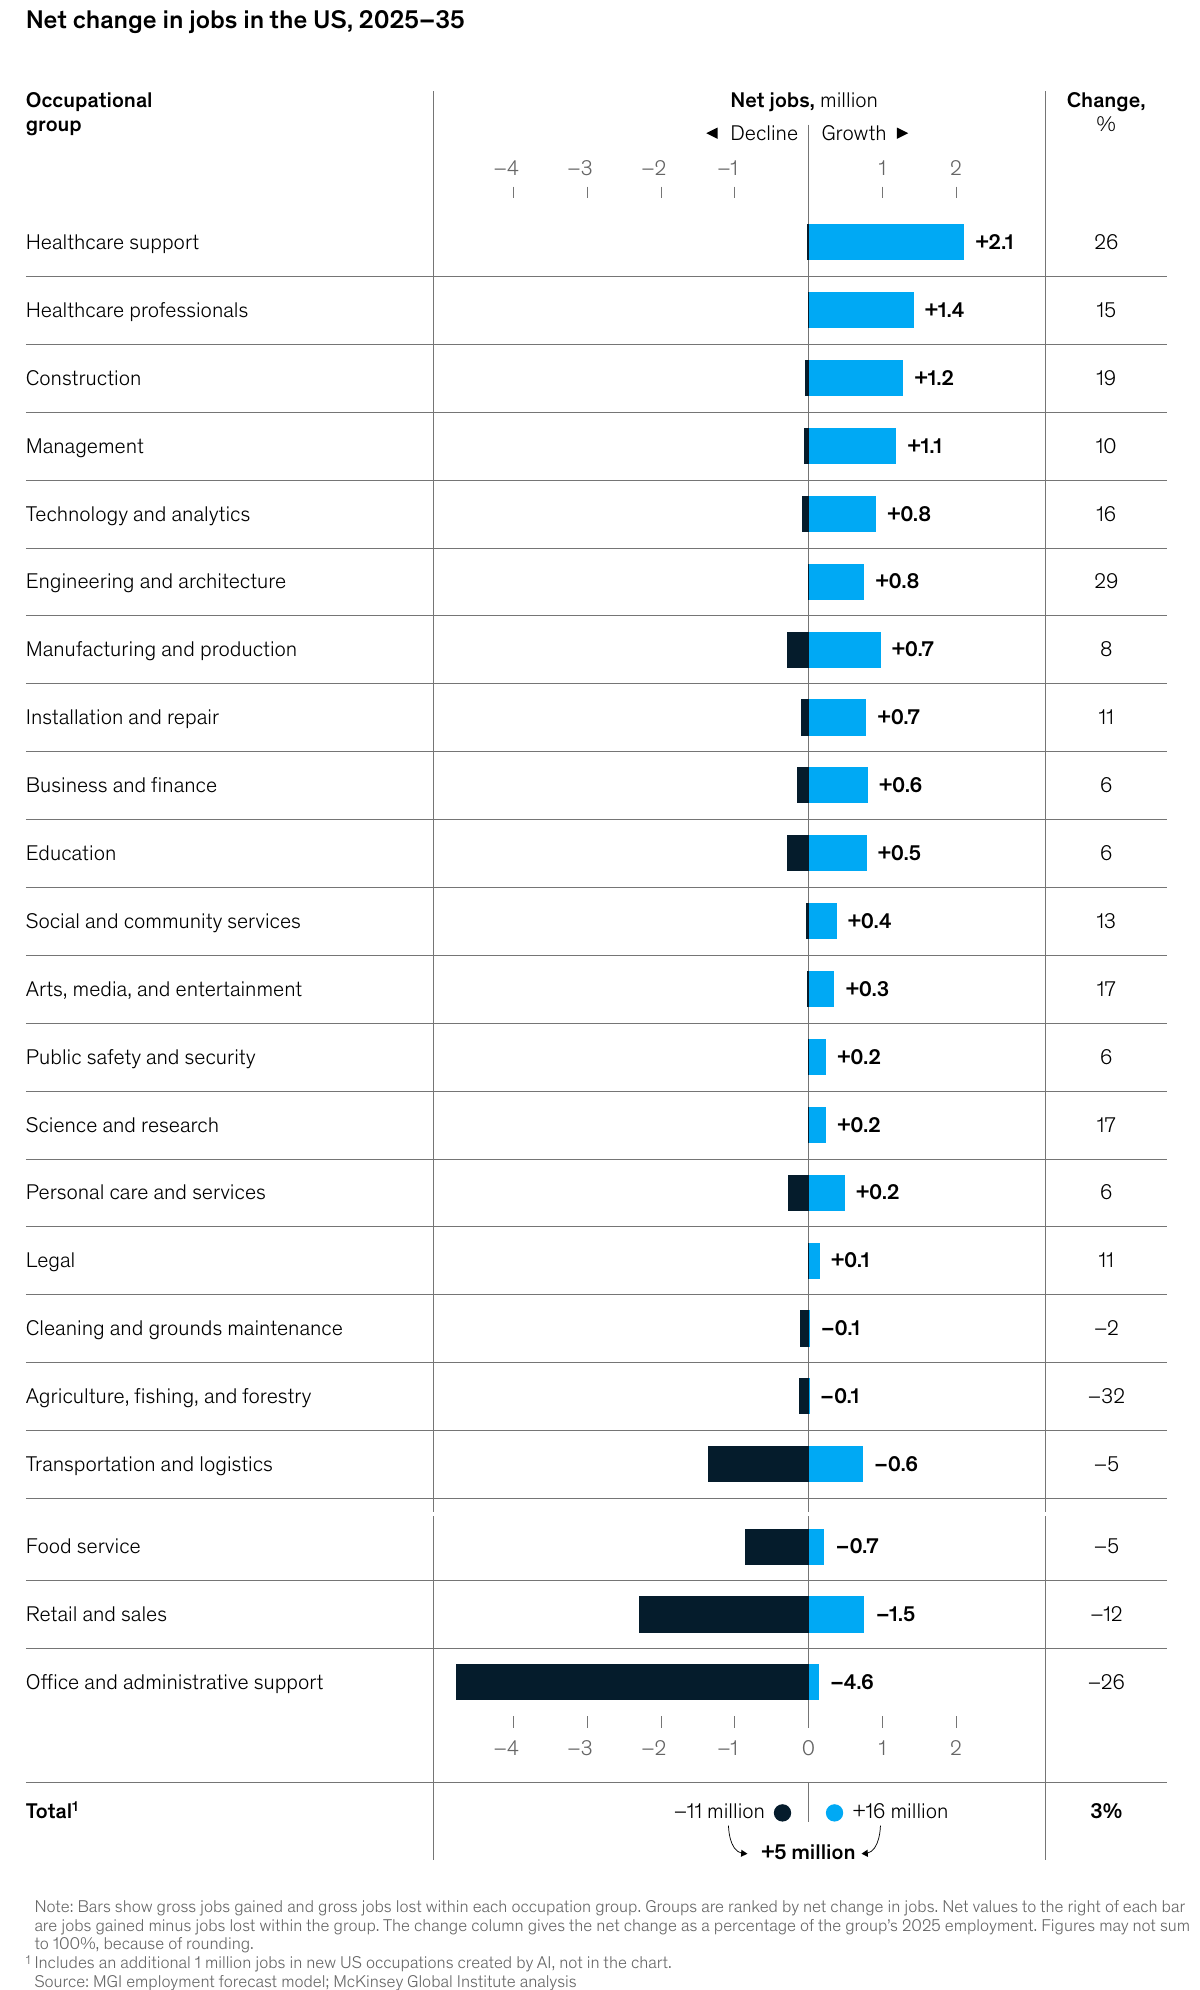
Office and administrative support alone is projected to lose a net 4.6 million jobs, a 26 percent drop. Retail and sales loses 1.5 million, food service 0.7 million, transportation and logistics 0.6 million. On the other side, healthcare support gains 2.1 million jobs (26 percent), healthcare professionals 1.4 million, construction 1.2 million and management 1.1 million. By sector, retail trade is projected to shrink 16 percent while healthcare and social assistance grows 13 percent.
The growth is mostly somewhere other than the decline. A cashier may have customer-interaction, basic digital and reliability skills, the report says, but the jobs likely to grow are in caregiving, construction support, healthcare support and business operations. An administrative assistant has coordination, scheduling and documentation skills, but the most attractive growing jobs may call for management, business operations, technology or specialized process skills.
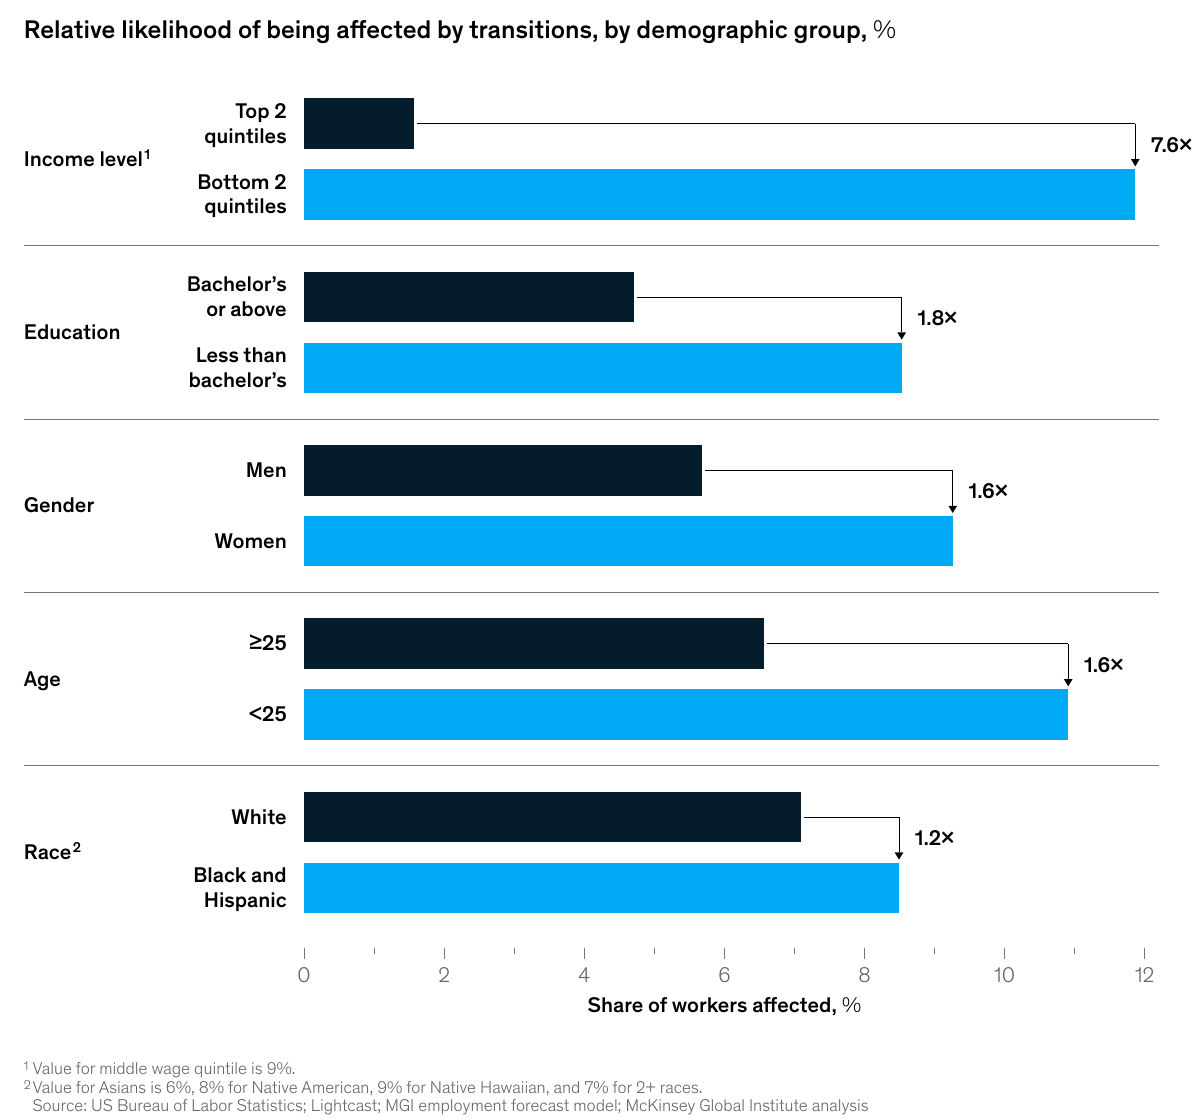
The burden falls unevenly. Workers in the bottom two wage quintiles are 7.6 times as likely as those in the top two to need a wholly new occupation. Workers without a bachelor's degree are about 1.8 times as likely as those with one. Younger workers are about 1.6 times as likely as prime-age workers, women about 1.6 times as likely as men, and Black and Hispanic workers about 1.2 times as likely as White workers. The report attributes that last gap to those groups' representation in the occupations where automation is more likely to reduce demand.
Staying put and changing anyway
Not everyone affected changes occupations. The report estimates that about 25 percent of workers could see more than 30 percent of their task time reallocated, either reshuffled within existing activities or shifted to new ones. Another 47 percent could see 15 to 30 percent reallocated. Only 28 percent fall into what it calls low reinvention. In its accounting, more than 70 percent of workers need some level of it, whether their occupation grows, shrinks or holds steady.
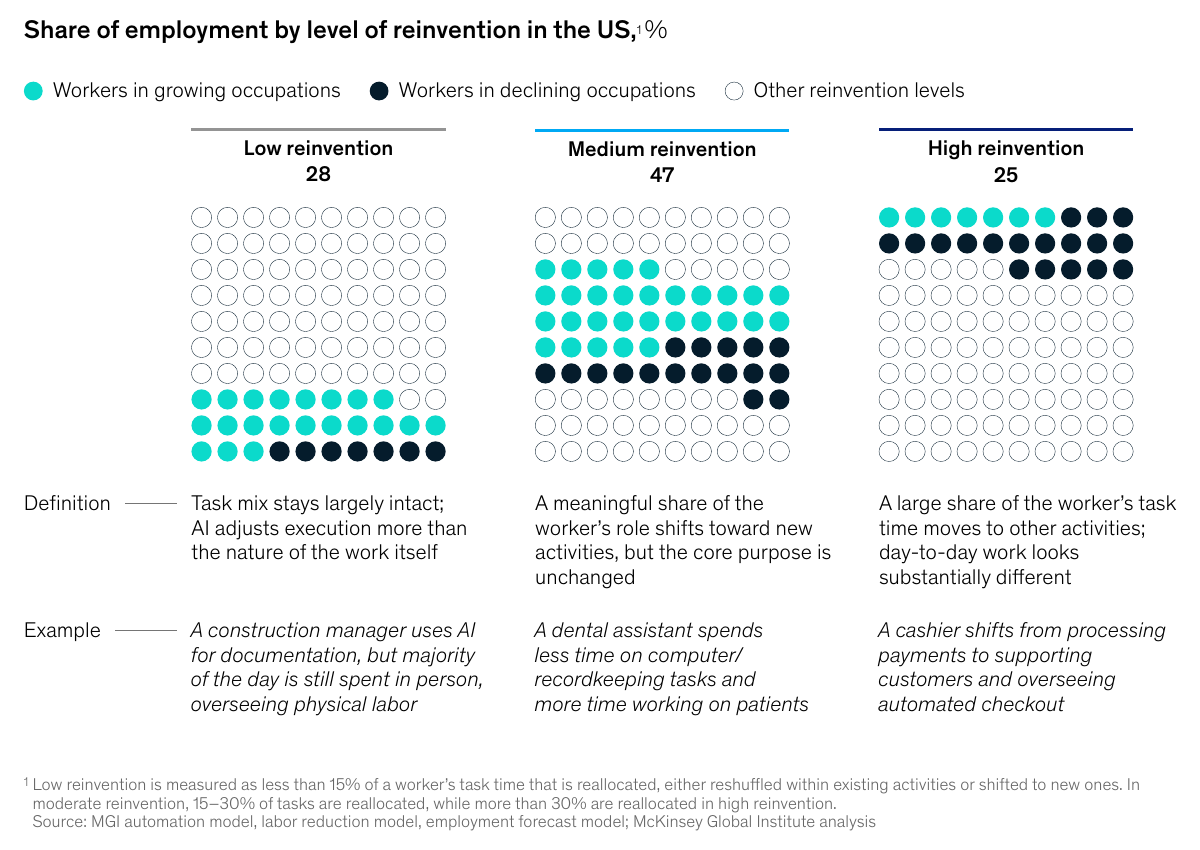
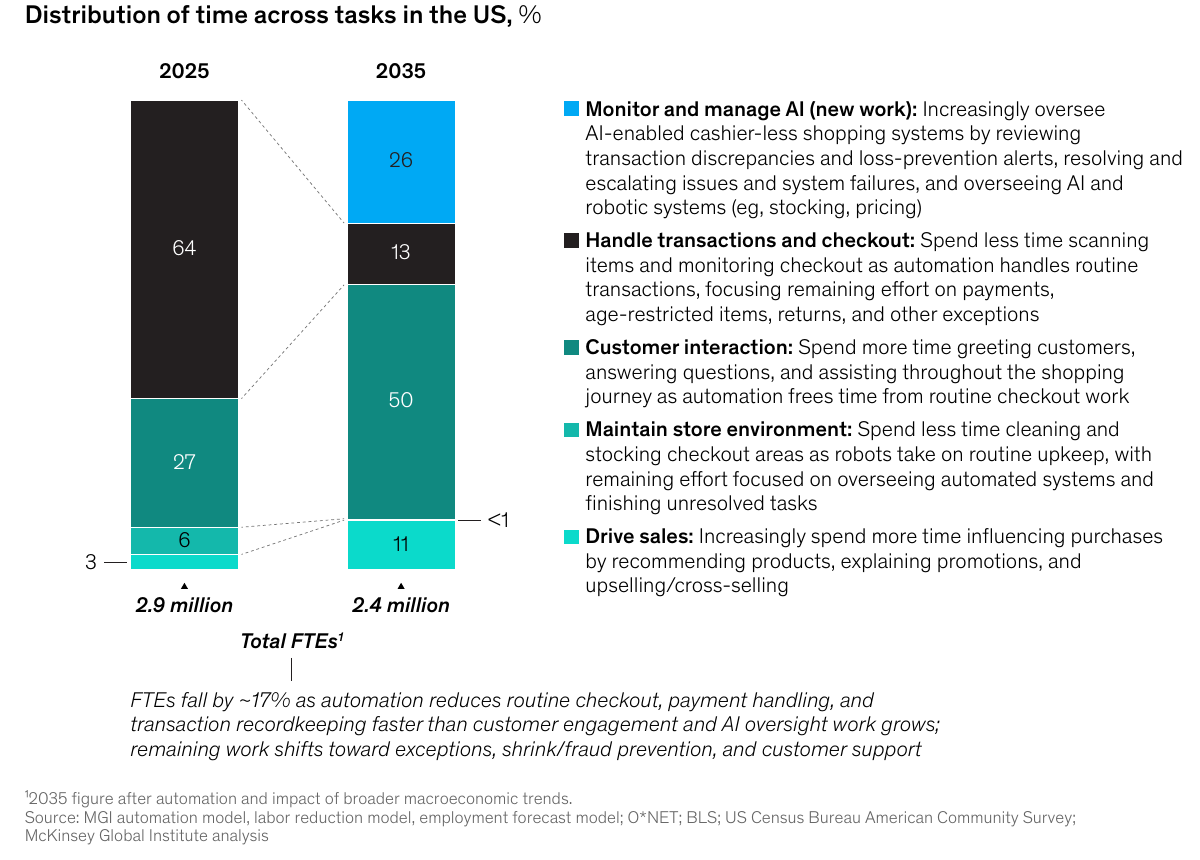
Cashiers show what this looks like in an occupation that is shrinking. In 2025, the report estimates, they spend 64 percent of their time handling transactions. By 2035 that falls to 13 percent. Customer interaction rises from 27 percent of the day to 50 percent, and a new category, monitoring and managing AI systems, takes 26 percent. Employment falls about 17 percent, from 2.9 million full-time equivalents to 2.4 million.
Middle and high school teachers, about 367,000 full-time equivalents, fall to about 350,000 as the school-age population shrinks, and 12 percent of their time goes to checking AI-generated lesson content and grading suggestions. Tractor-trailer truck drivers go the other way, from 1.3 million to 1.5 million, because freight demand grows faster than automation removes driving work. Insurance underwriters hold flat at 57,000 while spending less time gathering applicant data and more judging it.
One route in seven
Nearly every worker who needs to change occupations has some route to growing work, the report finds. The routes differ in quality, and the institute sorts them by four measures. A direct pathway leads to a growing occupation, requires at least 75 percent skill overlap with the worker's current one, preserves current pay and needs less than six months to earn any legally required credential. A winding pathway needs at least 50 percent overlap, at least 90 percent of current pay and less than 24 months of training. Everything else is unpaved.
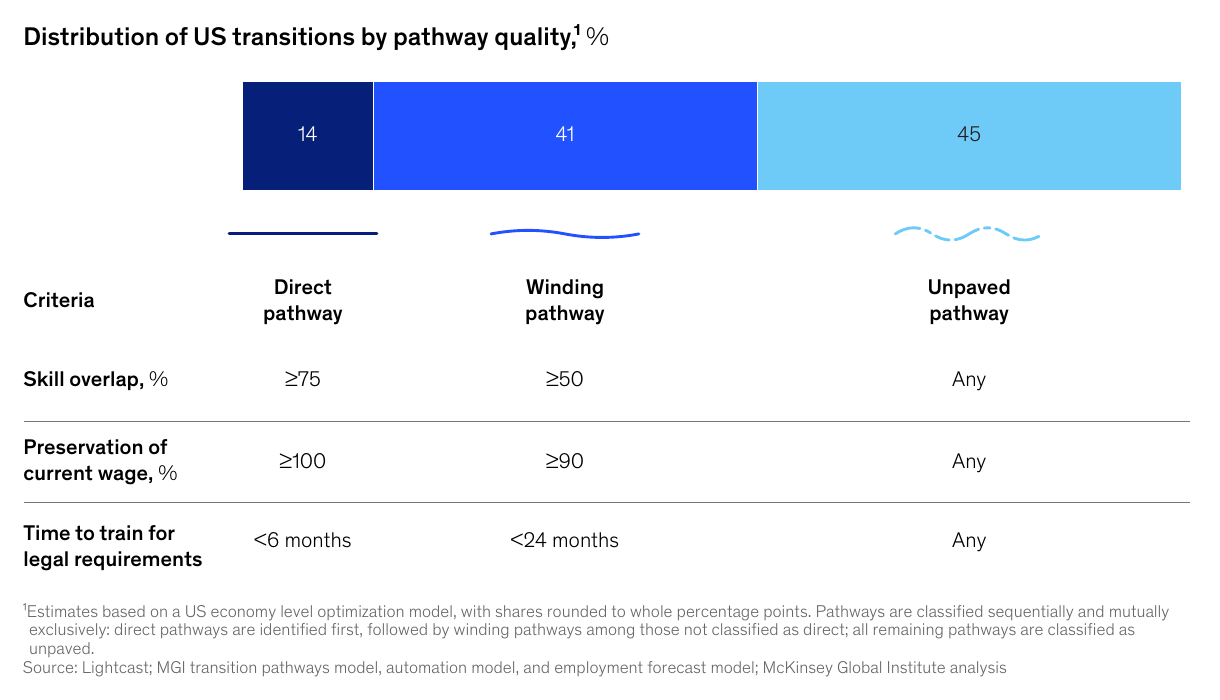
Where a worker starts changes the odds. Almost half of office and administrative support workers who need to move may follow winding pathways, and more than 60 percent of retail and sales workers could face unpaved ones. Transportation and logistics workers are more likely to have winding or straight routes.
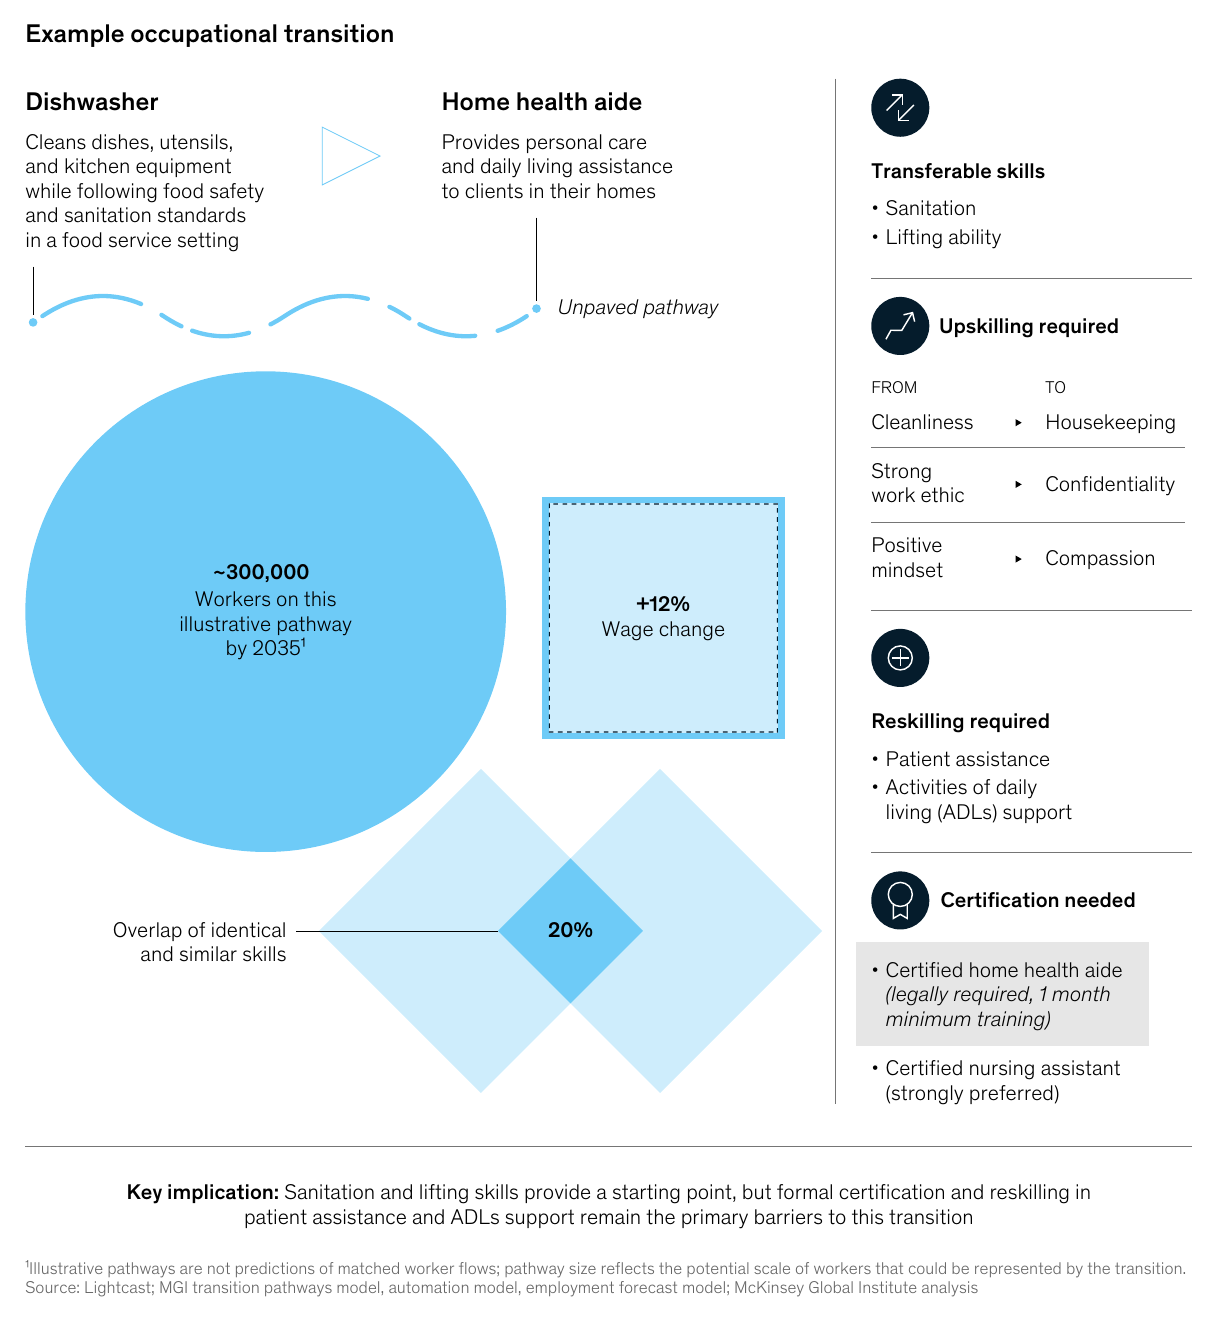
The report walks through three transitions. Dishwashers moving into home health aide jobs share sanitation and lifting skills, but the two occupations overlap by only 20 percent. The aide job pays about 12 percent more, yet it legally requires certification, with at least a month of training, and employers strongly prefer a certified nursing assistant credential. The report sizes that illustrative pathway at about 300,000 workers by 2035 and cautions that such figures are not predictions. It classifies the route as unpaved, raise included.
Packagers moving into production assembly overlap by 52 percent, gain about 10 percent in pay and need no certification, though they would have to learn drilling, fine motor skills and mechanical assembly. Office assistants moving into project management overlap by 58 percent, and the report puts the wage change at 154 percent. It also finds that many would need a bachelor's degree and a professional certification, “one of the greatest investments in education and credentialing” among its examples.
“But feasibility is not the same as ease.”McKinsey Global Institute
Higher pay, more demands
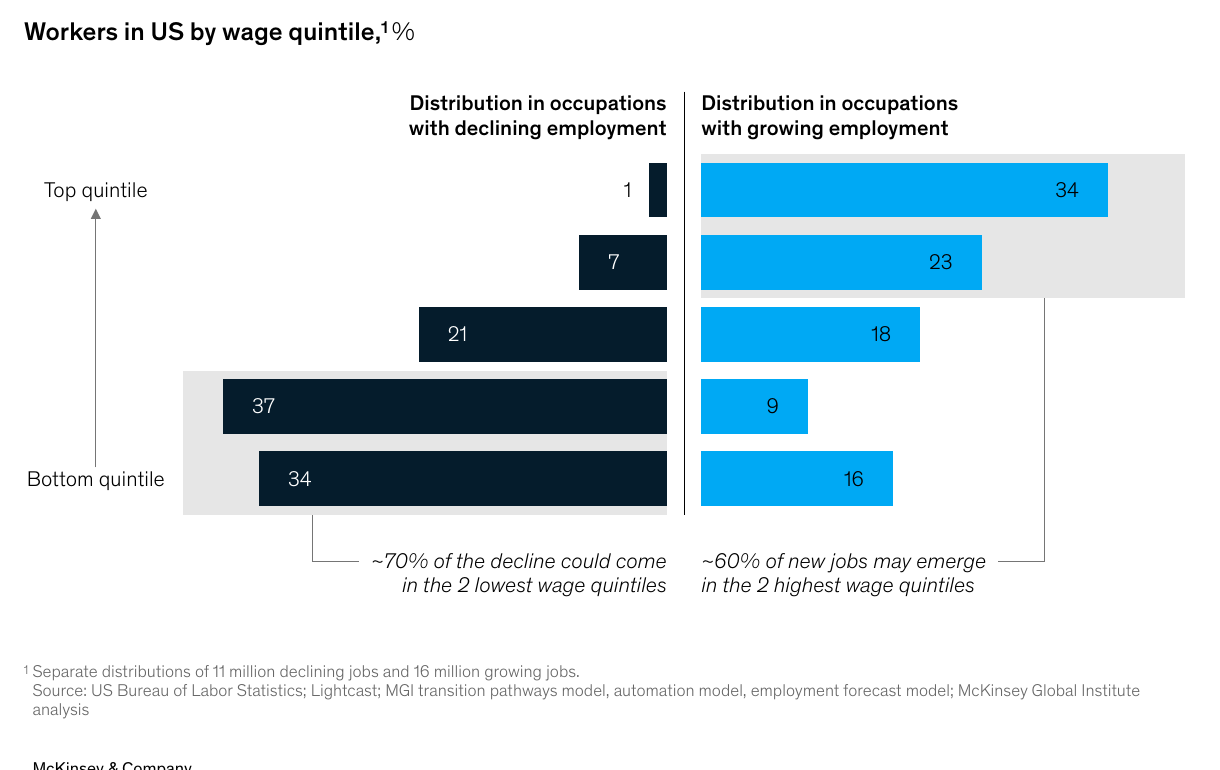
Money is not where most routes fail. Only 3 percent of the 11 million, roughly 305,000 workers, would follow a pathway that requires a pay cut. Across the economy, 57 percent of employment in growing occupations falls in the top two wage quintiles, while more than 70 percent of declining jobs are in the bottom two. The economy sheds lower-wage work and adds higher-wage work.
The wage analysis holds current wage levels within each occupation constant, so it does not capture any change as labor supply and demand rebalance. And the pay comes with conditions. Job postings in growing occupations seek 68 distinct skills on average, against 47 in declining ones. Some 84 percent of growing occupations require postsecondary education, compared with 45 percent of declining ones.
Access to the direct routes is uneven. Workers in the top wage quintile are four times as likely as those in the bottom quintile to have one. Only 10 percent of workers in the lowest quintile, who earn less than $38,000 a year, are likely to have a direct pathway, against almost 40 percent in the fifth. Workers with more than a bachelor's degree are about 50 percent more likely to have one than those with a bachelor's or less, and men are about 30 percent more likely than women.
What employers are starting to ask for
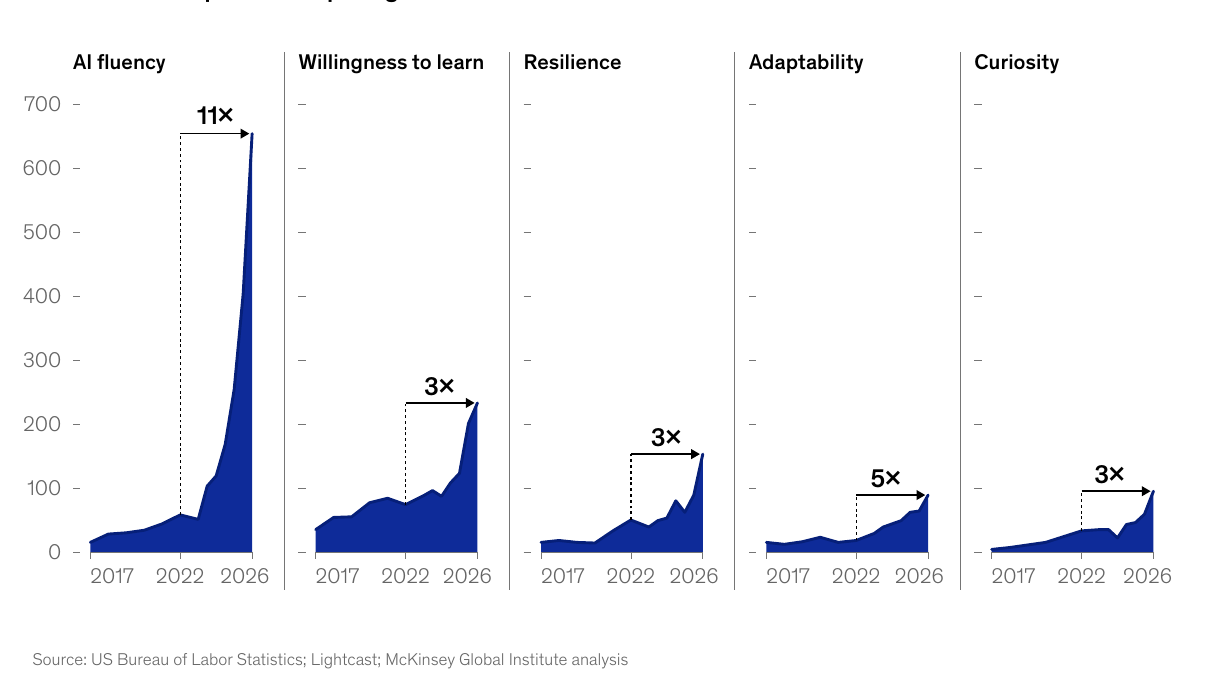
The report divides skills into three groups. Essential skills, such as problem-solving, leadership, interpersonal communication and detail orientation, are demanded by more than 75 percent of occupations and widen the range of jobs within reach. Enabling skills, including decision-making, innovation and critical thinking, transfer across occupations but concentrate in higher-paying roles, which average more than $83,000. Empowering skills are AI fluency, willingness to learn, resilience, adaptability and curiosity, the ones that let a worker keep adapting as a job changes.
Job postings are moving fastest on the last group. Between 2022 and 2026, the number of occupations asking for AI fluency rose about 11-fold. Adaptability rose about fivefold. Willingness to learn, resilience and curiosity roughly tripled. AI fluency appears in far more occupations than any of the others, and the report warns that if demand for the rest does not keep pace, employers “risk building a workforce that can use today's AI tools but is no better equipped to adapt to the next set of changes those tools may bring.”
The locks on the door
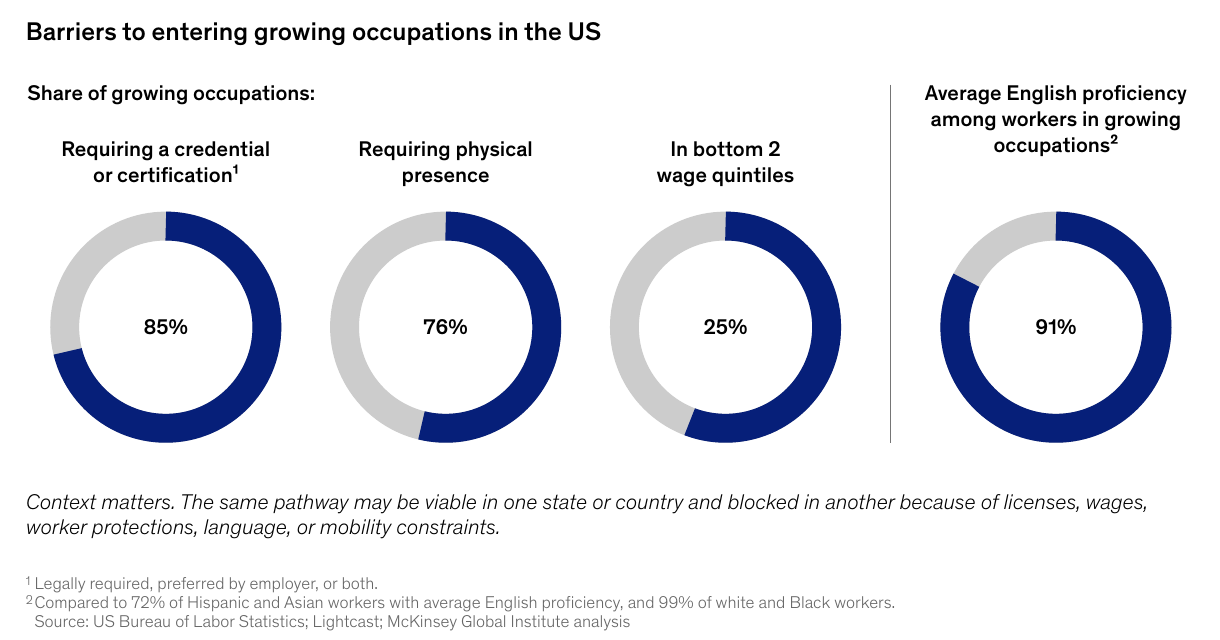
Skills open the door, but the report spends a full chapter on what is bolted across it. About 85 percent of growing employment calls for a credential of some kind, whether legally required or preferred by employers. About 76 percent of it cannot be done remotely. About a quarter is in the bottom two wage quintiles.
Legal requirements cover about 38 percent of growing employment, concentrated in healthcare, law, transportation, education, engineering and public safety. Among growing healthcare professional occupations, 96 percent require a mandated license or certification. Another 47 percent of growing jobs have no legal requirement but employers prefer a credential anyway, according to job postings. Only 15 percent of growing jobs have no credential requirement at all.
Training time separates the realistic from the theoretical. For occupations with a legally required credential, the average is about 32 months for someone who finished high school and 17 months for someone with a bachelor's degree. The averages hide a wide range. Growing healthcare support jobs average under six months. Growing jobs in education, engineering and architecture, and healthcare professions average more than two years.
Then there is pay. “Avoiding a pay cut is not the same as finding a wage high enough to justify a transition,” the report says. About 97 percent of growing food service employment and 92 percent of growing healthcare support employment is in the bottom two wage quintiles. Training itself costs income. Workers with limited savings, caregiving duties or no access to paid training, it says, “may rationally decline a pathway that looks favorable on paper.”
Geography compounds it. Matched only to growing occupations in the state where they live, workers with a direct pathway fall by 5 percent. More than 90 percent of the workers in growing technology and analytics, business and finance, and office and administrative support occupations can work remotely. Healthcare support, education, installation and repair, and food service offer essentially none. The average distance between workers and their employer's worksite rose more than 70 percent from 2019 to 2024, though the report says the gains went mostly to higher-paying office roles.
Language adds a layer. About 91 percent of current workers in growing jobs are proficient in English, but the figure is roughly 72 percent among Latino and Asian workers. About a third of growing job postings mention English proficiency explicitly.
The barriers overlap. Healthcare support and food service jobs are largely low-wage and offer almost no remote work. Transportation and logistics jobs may require extensive legal credentialing and cannot be done remotely. “A moderately winding pathway on any single dimension,” the report says, “can be blocked by compounding barriers.”
What the report asks of everyone
No single actor can build these pathways, the institute argues, and it addresses four.
Companies are told to identify talent by skills instead of job titles, build internal mobility into workforce planning and track redeployment and internal fill rates next to cost savings. Its endnotes cite McKinsey research finding that 88 percent of organizations have adopted AI in at least one business function while formal guidance remains limited, and that more than half of US workers say they have not been consulted on how AI will fit into their roles. Other McKinsey research finds that companies expect to retrain nearly a third of their workforce.
Governments cannot pick the growing occupations, the report says, but they can improve labor-market data, support modular and stackable credentials and finance transitions. It points abroad for models: individual learning accounts and portable training credits such as Singapore's SkillsFuture Credit and France's Compte personnel de formation, and Sweden's Transition Study Support, which replaces income during training.
Educators are urged to design training backward from a growing occupation, starting with the skills it needs and the ones workers already have, and to publish employment and wage outcomes, as the US College Scorecard and Britain's Longitudinal Education Outcomes data already allow.
Workers are asked to build portable skills, AI fluency among them, and to expect their jobs to change even if they stay put. The report concedes the cost. The time, money and confidence required weigh more on lower-wage workers, older workers and caregivers, and it links that to lower participation in retraining.
What the numbers rest on
Two assumptions carry the most uncertainty: how fast organizations adopt automation, and how much of it translates into lower demand for labor. The institute tests alternatives rather than drawing precise bounds. If adoption moves materially faster or reduces demand more, the number of workers who must change occupations could rise from 11 million to more than 16 million. If adoption is slower or the reduction smaller, it could fall to about six million.
Other choices in the method matter for how far to trust the pathway figures. Wages are advertised base pay, not total compensation. The authors used a large language model to identify and synthesize publicly available credential requirements and to derive estimated training times. In a sidebar on food service, where employment has stayed below pre-pandemic levels for waiters and waitresses (about 12 percent lower from May 2019 to May 2025), the report says those shifts “do not establish automation as the cause.”
The institute says none of its work is commissioned or funded by any business, government or other institution, and that it is funded by the partners of McKinsey.
The base case is 11 million workers. The faster scenario is more than 16 million and the slower is about six million. The report finds that 85 percent of the growing employment they would be moving into calls for a credential of some kind.
All figures and quotations are from the McKinsey Global Institute report cited above, and all charts are exhibits from that report, reproduced with credit. The report is proprietary to McKinsey & Company. Cover photograph: Robyn Beck/AFP via Getty Images.