

India Macro · Q1 FY2026-27
The Number Behind
the Number
The 7.8 percent print survives arithmetic reconstruction. What it rests on is a set of price assumptions that published data cannot verify.
Photograph by Morten Ross, used under CC BY 4.0
India's statistics ministry reported real GDP growth of 7.8 percent for the April-to-June quarter, against a Reuters poll consensus of 7.1. Subhash Chandra Garg, finance secretary from 2017 to 2019, put the figure at 2.6 percent and three days later at about 5. Little of the argument that followed addressed the level at which the disagreement actually resides, which is the treatment of prices.
The arithmetic is sound. Summing MoSPI's published sectoral gross value added and its published net indirect taxes reproduces the headline at both constant and current prices, to within five basis points. The published total is consistent with its published components, and our reconstruction of the economy-wide deflator, at 2.31 percent, matches the 2.3 percent the statistics secretary gave reporters on 2 September.
What the headline rests on is harder to verify. Two of the nine components carry negative implicit deflators, and a third, the largest block in the economy, carries one close to zero. Together they account for 46 percent of GDP. For two of them no independent price or volume series exists against which the published treatment can be tested.
The published figure is consistent with the official volume and price data under the ministry's chosen deflator treatment. Alternative and still-plausible treatments of the two largest residual uncertainties produce a range of roughly 6.4 to 7.9 percent, with a central scenario near 7.1. That range measures sensitivity to assumptions we cannot check. It is not a competing estimate of Indian output, and it does not imply the ministry's treatment is wrong. The official tables do not yield 2.6 percent, nor the approximately 5 percent offered three days later, under any coherent method we were able to construct.
Two findings warrant more attention than they have received. The rebasing cut measured GDP by ₹43.9 lakh crore across four years, and the accounting source of that cut was not lower output but a large upward revision to the cost of inputs. And the reforms that produced this disputed number are the ones the IMF spent last year asking for.
This note reconstructs the quarterly national accounts for Q1 FY2026-27 (April to June 2026) released by the National Statistical Office under MoSPI on 31 August 2026. All growth rates are year on year unless stated. Constant-price figures use the 2022-23 base introduced in February 2026 and are not comparable with the 2011-12 series.
Data cutoff. The latest official statistical release incorporated is the Index of Industrial Production for June 2026, published 31 July 2026. Press reporting and named commentary are incorporated to 10 September 2026. No data published after those dates has been used.
Attribution of figures. Tables and figures distinguish throughout between values as published by MoSPI or PIB, and values calculated by Icarus Asia from them. Every implied deflator, contribution and scenario in this note is an Icarus Asia calculation and is labelled as such in the relevant table or editor's note. The note contains no forecasts and no nowcasts; the scenario rows in Table 2 are sensitivity illustrations, not estimates of Indian output.
01 — The reconstruction
The addition checks out
GDP is not a single figure handed down from a model. It is gross value added by sector, summed, plus net taxes on products. MoSPI publishes every component of that sum, so the headline can be rebuilt from its parts instead of taken on trust.
At constant 2022-23 prices, primary, secondary and tertiary GVA came to ₹68.19 lakh crore in Q1 FY26 and ₹73.82 lakh crore in Q1 FY27. Add net taxes of ₹7.25 lakh crore and ₹7.54 lakh crore and you have ₹75.44 lakh crore against ₹81.36 lakh crore. Growth of 7.85 percent, against a published 7.8. Run the same exercise at current prices and you get ₹80.00 lakh crore against ₹88.27 lakh crore, or 10.33 percent nominal, against a published 10.3.
Both match.
| Component, Q1 FY27 | Weight % of GDP, constant prices |
Real % YoY, constant 2022-23 prices |
Nominal % YoY, current prices |
Implied deflator % YoY |
Contribution pp of real GDP growth |
|---|---|---|---|---|---|
| Agriculture & allied | 15.9% | 3.68% | 7.54% | +3.73% | 0.58pp |
| Mining & quarrying | 2.1% | −1.89% | 22.29% | +24.64% | −0.04pp |
| Manufacturing | 12.4% | 9.17% | 7.68% | −1.36% | 1.14pp |
| Electricity, gas, water | 2.3% | 9.09% | 9.71% | +0.57% | 0.21pp |
| Construction | 8.3% | 7.62% | 16.49% | +8.24% | 0.64pp |
| Trade, hotels, transport | 13.5% | 8.52% | 14.00% | +5.05% | 1.15pp |
| Financial, real estate, IT & prof. | 23.8% | 12.12% | 12.70% | +0.52% | 2.89pp |
| Public admin. & defence | 11.9% | 7.45% | 10.98% | +3.28% | 0.89pp |
| Net taxes on products | 9.6% | 4.00% | −0.40% | −4.24% | 0.38pp |
| GDP | 100.0% | 7.85% | 10.33% | +2.31% | 7.85pp |
Table 1. Built from the MoSPI Press Note on GDP Estimates for Q1 2026-27, 31 August 2026, statements 1 to 4 and the annexure. The deflator column is the implied ratio of nominal to real growth, calculated by Icarus Asia; MoSPI does not publish sectoral deflators. Our 2.31 percent GDP deflator matches the 2.3 percent the statistics secretary gave reporters on 2 September. Constant-price sector values are given to two decimal places in lakh crore, which is why our GDP total lands five basis points above the published 7.8 percent. Shaded rows are the three components taken apart in sections 05 to 08. One lakh crore is one trillion rupees; the note uses lakh crore throughout.
02 — The rebasing
India rebased, and the level fell
Garg's complaint began with a level, not a rate. Under the old series the government put nominal GDP for the year-earlier quarter at ₹86.05 lakh crore. The new series revised that quarter down to ₹80 lakh crore. Compare this year against the old figure and growth looks like 2.6 percent; compare it against the revised one and you get 10.3 nominal.
V. Anantha Nageshwaran, the chief economic adviser, called that cherry-picking, and on the arithmetic he is right. Two series measured with different rulers do not subtract. Some quarters get bumped up in a revision and some get bumped down, he said, and the revised base was published in February, months before the Q1 print that set off the row.
Garg's rejoinder is the better half of his case. A change in methodology, he told CNBC, does not explain “what went out of the production to bring down the value of last year's GDP by six trillion rupees.” Where, in other words, is the missing GDP. Section 03 answers that, and the answer is more interesting than either side has made it sound.
Seniority has not settled this. Kaushik Basu, now at Cornell, chief economic adviser in Delhi before that and chief economist at the World Bank after, called Garg's analysis “the best analysis I have heard.” Krishnamurthy V. Subramanian, another former chief economic adviser, called it “a hilarious demonstration of economic ignorance.” Both men have held the same job.
The scale of the revision is real whoever is doing the arguing. Moving the base to 2022-23 cut the GDP level for that year by ₹7.7 lakh crore, to ₹261 lakh crore, about 3 percent. A 2022 IMF working paper looked at 78 economies that rebased in recent years and found the median one revised up by 3.5 percent. India went the other way, and by a wide margin. Across four years the cumulative cut is ₹43.9 lakh crore. The Congress party has been campaigning on a rounder version of the same number, ₹43 lakh crore, or about $455 billion.
Grading India's national accounts a C in its 2025 country report, its second-lowest rank, the IMF named three faults: an outdated base year, reliance on the wholesale price index, and the use of single deflation. India's February overhaul changed all three. The number now in dispute is the product of doing what the Fund asked for.
Sanjeev Sanyal, of the prime minister's Economic Advisory Council, has made the timing argument: statisticians normally rebase at the start of a decade, India's decade opened on the Covid years, and 2024 was the first usable baseline. Dying industries drop out of the basket and faster-growing ones come in, which lifts the measured growth rate mechanically. That is true of every rebasing anywhere. It is also the reason a rebasing quarter deserves a closer look rather than a shorter one.
03 — The missing GDP
Output did not fall. Input costs rose.
Anil Sood, of the Institute of Advanced Studies in Complex Choices in Mumbai, went through the revised National Accounts Statistics line by line and found what nobody campaigning on this number has mentioned. Gross value added across the four revised years is down ₹41.3 lakh crore and GDP is down ₹43.9 lakh crore, the difference between the two being taxes, concentrated in FY2025-26. So far, so much what the critics say.
Then the mechanism. In Sood's words, “the proximate accounting source of the lower GVA estimate is not a downward revision of output, but a much larger upward revision of the intermediate goods and services used in producing that output.” Output went up. Intermediate consumption went up more, by over 2 percent in both years, concentrated in construction, trade and repairs, hotels, real estate and professional services, with manufacturing revised substantially as well.
Nothing went out of production. The new series says more of what India produces is consumed producing it.
Two other components moved. Consumption of fixed capital rose across utilities, mining and public administration, and in public administration and defence the combination is peculiar: GVA revised down ₹62,814 crore while capital consumption rose ₹91,577 crore. Compensation of employees fell roughly ₹7.2 lakh crore across two years. Sood's summary is that the revision shows an economy where “more of gross output is absorbed by intermediate inputs, more of gross value added is absorbed by capital consumption, and less net income is recorded as compensation or operating surplus,” and that the revised economy is “even more capital-intensive and less net-income-generating than the old economy.”
He is careful not to call this an error, and neither will we. A statistical system that can now see contractor chains and intermediate transactions it previously missed would produce exactly this pattern, and so would procurement inefficiency, related-party billing, or genuine fragmentation of production. Those are different worlds with the same accounting signature, and distinguishing them needs data nobody has published.
What matters for this note is narrower and harder to argue with. Value added is output minus intermediate consumption. Raise intermediate consumption materially and value added becomes a smaller residual between two larger numbers, which is precisely the condition the 2008 System of National Accounts manual warns about when it says such estimates are “extremely sensitive to error.” The rebasing did not merely change the level. It made the arithmetic underneath every real growth rate more fragile, and it did so in the same stroke that introduced double deflation.
04 — Demand side
What the expenditure accounts say
Sections 01 to 03 work from the production side, because that is where the disputed deflators sit. MoSPI publishes the expenditure side as well, and it repays reading, both for its own price story and because the two sides of the account do not close without assistance.
| Expenditure component, Q1 FY27 | Real, % YoY constant 2022-23 prices |
Nominal, % YoY current prices |
Implied deflator % YoY |
Share of GDP %, current prices |
|---|---|---|---|---|
| Private final consumption (PFCE) | 7.1% | 9.9% | +2.6% | 55.6% |
| Government final consumption (GFCE) | 4.3% | 9.5% | +5.0% | 11.1% |
| Gross fixed capital formation (GFCF) | 11.9% | 20.4% | +7.6% | 34.3% |
| Changes in stocks | −13.9% | 22.0% | n.m. | 1.5% |
| Valuables | −18.6% | 33.4% | n.m. | 1.0% |
| Exports of goods & services | 12.0% | 25.8% | +12.3% | 25.6% |
| Less: imports of goods & services | −1.1% | 30.9% | +32.3% | 28.3% |
| Discrepancies | ₹+1,36,528 cr in Q1 FY26 to ₹−1,06,005 cr in Q1 FY27, at constant prices | |||
| GDP, as published | 7.8% | 10.3% | +2.3% | 100.0% |
Table 3. Real and nominal growth rates, GDP shares and the discrepancies line are as published by MoSPI, Press Note on GDP Estimates for Q1 2026-27, statements 2 and 4. The implied deflator column is an Icarus Asia calculation from those published rates; MoSPI does not publish expenditure deflators. “n.m.” marks components where a deflator is not meaningful because the constant-price series is a net change rather than a flow. The GDP row is as published. MoSPI's own expenditure-table totals are ₹75,46,230 crore and ₹81,36,153 crore at constant prices and ₹80,00,192 crore and ₹88,26,871 crore at current prices, implying 7.82% real and 10.33% nominal growth; the components above plus the discrepancies line reproduce those totals exactly.
Investment led; the consumer followed
Gross fixed capital formation grew 11.9 percent at constant prices against 7.1 percent for private final consumption. At 34.3 percent of GDP at current prices, investment is the component carrying the quarter. Household consumption, at 55.6 percent of GDP, grew more slowly than the headline; government consumption at 4.3 percent grew more slowly than either. This is the composition Jaydeep Mukherjee of the Great Lakes Institute of Management has called unsustainable, and on the published figures he is describing the quarter accurately. The expansion is investment and export led, with the consumer improving rather than leading.
The two should be read separately, because their price behaviour differs. GFCF grew 20.4 percent nominal against 11.9 real, an implied deflator of 7.6 percent, consistent with the 8.2 percent construction deflator in Table 1 and with materials cost pressure through the quarter. PFCE grew 9.9 nominal against 7.1 real, an implied deflator of 2.6 percent, below the quarter's average consumer inflation of 3.93 percent. Investment is growing quickly in volume terms while paying visibly more for what it buys; consumption is growing more slowly while facing a measured price increase below the household index.
Does the consumption print square with volumes
Real consumption growth of 7.1 percent is faster than India's household sector has recently managed, which makes it worth a check against quantities sold. Automobile dispatches are the cleanest quarterly volume series available. SIAM reports passenger vehicle dispatches of 1,273,811 units for April to June 2026, up 25.9 percent from 1,011,884 a year earlier; two-wheelers at 5,628,675 units, up 20.3 percent; three-wheelers up 29.7 percent; and commercial vehicles up roughly 18.3 percent.
Those are dispatches from manufacturers to dealers rather than retail sales, so they record what the industry expected to sell alongside what households bought, and inventory build at the dealer level would flatter them. SIAM's president attributed the strength to domestic demand “aided by lower GST rates, softer financing costs” and new model launches. That attribution matters for section 07: the same rate change that turns the net indirect tax deflator negative is, on the industry's own account, part of why the volumes are there.
Fast-moving consumer goods would be the better test of breadth, since automobiles are a financed, urban-weighted and GST-sensitive purchase. Sector-wide FMCG volume data for April to June 2026 was not available at our data cutoff. NielsenIQ's most recent published read covers October to December 2025, when rural volumes grew 2.9 percent and urban 2.3, with the agency expecting the GST change to lift consumption from the January to March quarter onward. Reported revenue at three large listed manufacturers for the June quarter is at least consistent with recovery in value terms: Hindustan Unilever up 10 percent to ₹17,341 crore, Dabur up 11 percent to ₹3,764 crore, and Britannia up 25.2 percent to ₹6,378 crore. Revenue is not volume, and three companies are not a sector. The consumption print is supported by the volume evidence available, and that evidence is thinner than the print deserves.
The two sides do not close
Sum the published expenditure components and the total exceeds published GDP. MoSPI prints the residual as “discrepancies”: plus ₹1,36,528 crore in Q1 FY26 and minus ₹1,06,005 crore in Q1 FY27 at constant prices, a swing of ₹2.43 lakh crore between two consecutive quarters. Excluding that residual, the expenditure components grew 11.2 percent in real terms against a published headline of 7.8. At current prices the same exercise gives 12.1 percent against 10.3.
A discrepancy line is normal in national accounts and its presence is not a criticism. Its size here is worth recording. The residual moved by roughly 3.2 percent of the prior-year GDP base across two quarters, and it moved in the direction that brings a faster-growing expenditure aggregate down towards the production-side headline. Section 10 returns to why that matters: the supply-use framework intended to reconcile the two sides has so far been applied only to the current-price estimates.
That last figure deserves its own line. An implied import deflator above 32 percent is the expenditure-side counterpart of the fuel and commodity shock running through sections 05 and 06, and because imports are subtracted in the expenditure identity, a high import deflator mechanically lifts measured real GDP. We have not attempted to quantify that effect, because doing so would require the import price detail that is not published, but readers weighing the headline should know the channel exists.
05 — Prices
Three components, 46 percent of GDP
Real growth of 7.85 percent against nominal growth of 10.33 implies an economy-wide GDP deflator of 2.31 percent. Consumer inflation across the same three months averaged 3.93. Wholesale inflation averaged 9.30. The deflator sits below both.
Figure 1
Five readings of the same three months
Price change, % year on year, Q1 FY27. The GDP and GVA deflators are Icarus Asia calculations; the remaining three are published indices.
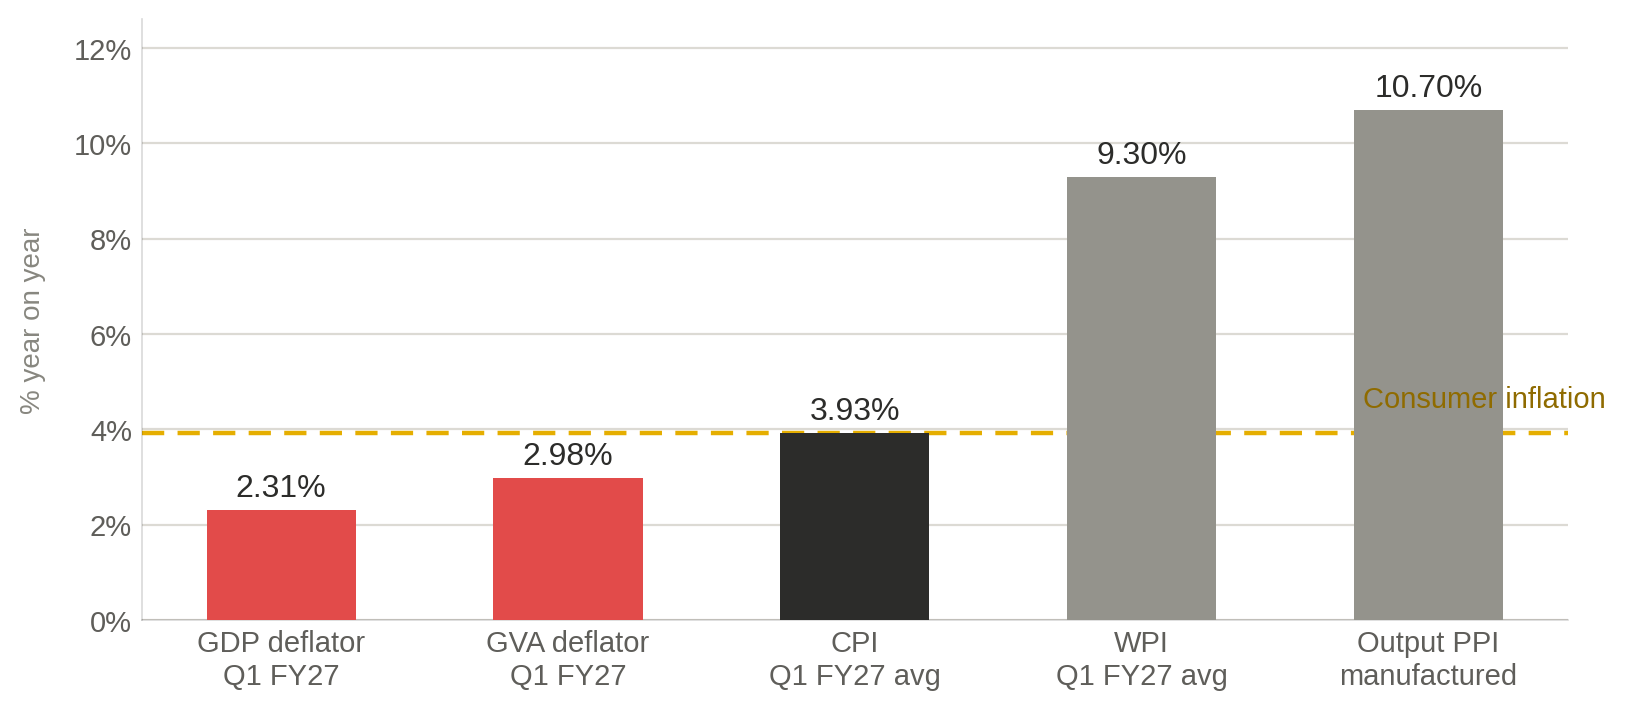
[Editor’s note] GDP and GVA deflators are Icarus Asia calculations from MoSPI’s published nominal and real growth rates. CPI and WPI are simple averages of the published April, May and June 2026 year-on-year rates. Output PPI for manufactured products is the quarterly figure given in MoSPI’s annexure. The five measures cover different baskets and are not substitutes for one another; they are here to locate the deflator, not to correct it. Sources: MoSPI Press Note Q1 2026-27; MoSPI CPI releases April–June 2026; PIB WPI and PPI release, June 2026.
On its own that proves nothing. A GDP deflator prices value added, not a shopping basket, and no rule requires it to land between CPI and WPI. The gap is also exactly what you would expect if input prices were climbing faster than output prices, which is the reading ICICI Securities Primary Dealership has taken. Societe Generale's economists look at the same gap and say it raises questions about the strength of real activity. Both are reading one number.
The wedge itself is the mechanism. With wholesale prices running 5.4 percentage points above consumer prices across the quarter, input-intensive sectors face cost inflation that their output prices have not matched, which compresses the value-added deflator wherever inputs and outputs are deflated separately and raises measured real value added in those sectors. Sectors whose costs are largely wages and whose output prices track the household basket, such as public administration, show nothing of the kind, which is why the deflators in Figure 2 fan out rather than cluster.
So take the number apart. The ratio of each sector's nominal to real growth backs out its implicit deflator.
Figure 2
The deflator does not fall evenly
Implicit GVA deflator by sector, % year on year, Q1 FY27. Weight in GDP at constant (2022-23) prices in parentheses.
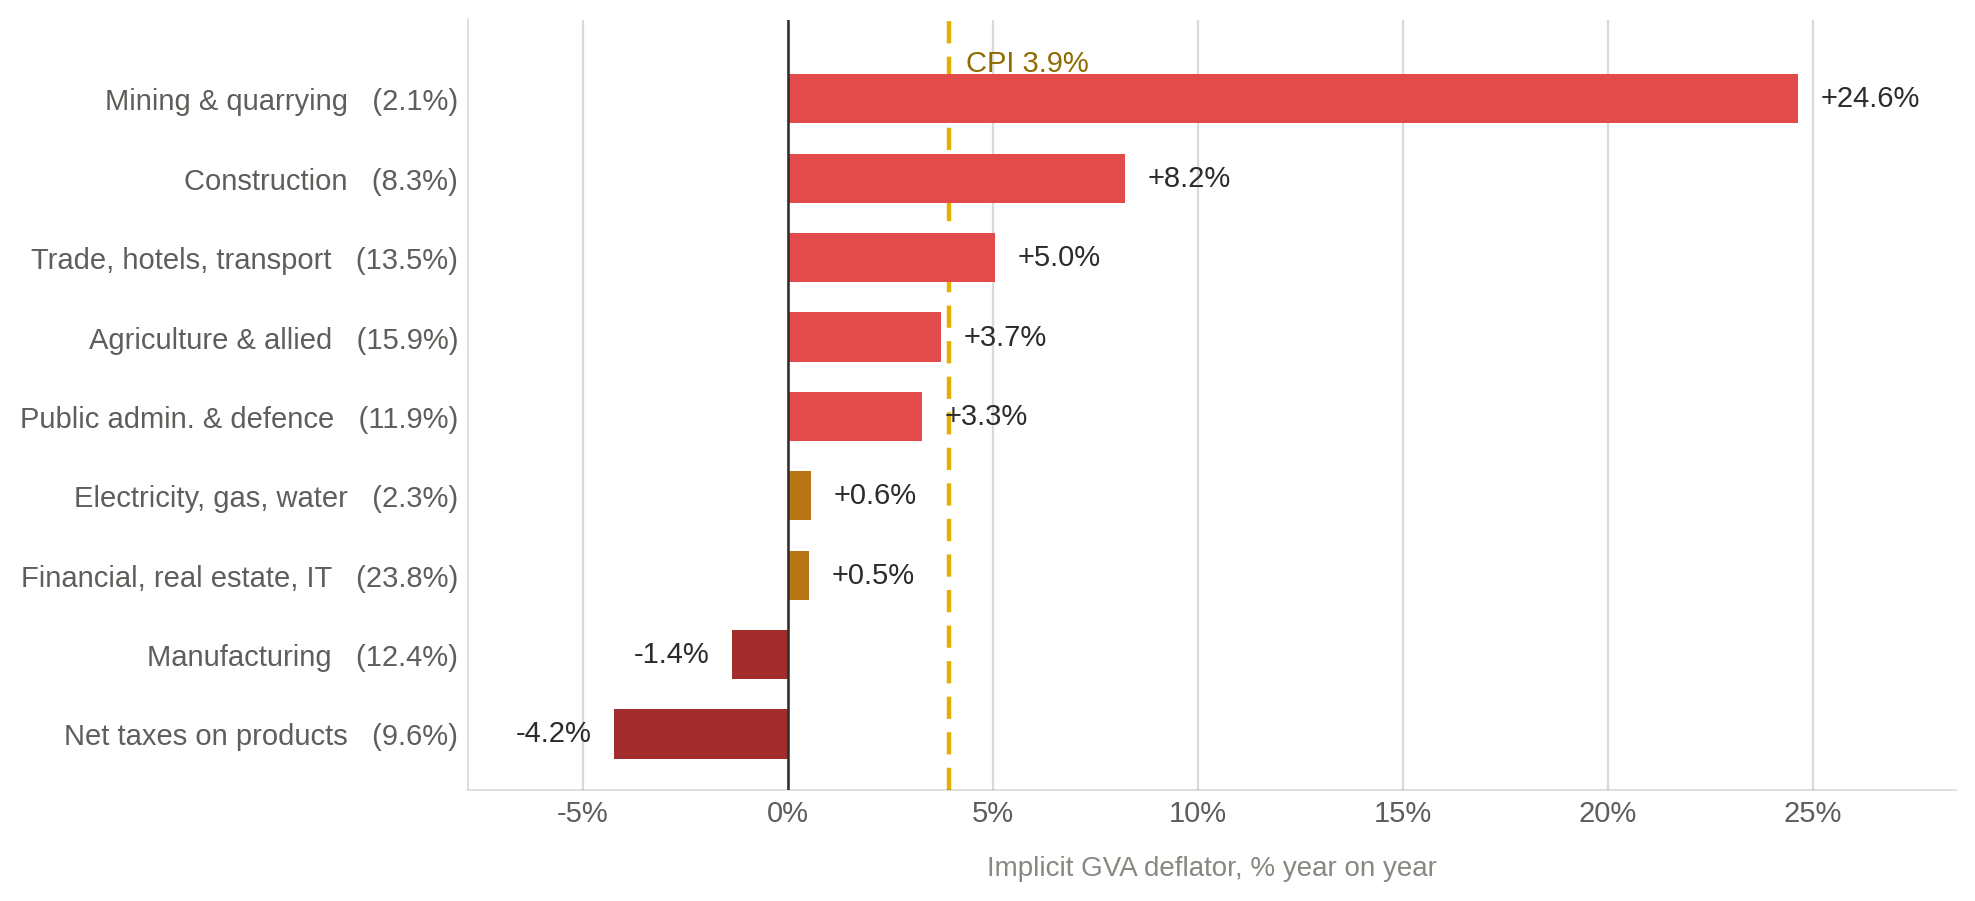
[Editor’s note] Sector deflators are Icarus Asia calculations from MoSPI’s published constant- and current-price GVA, not figures MoSPI publishes. The CPI reference line is the simple average of published April, May and June 2026 year-on-year rates (3.48%, 3.93%, 4.38%), base 2024=100. Sources: MoSPI Press Note Q1 2026-27; MoSPI CPI releases, April–June 2026.
Six of the nine behave unremarkably. Mining's 24.6 percent deflator tracks an output producer price index for mining that MoSPI reports at 19.5 percent, with crude petroleum and natural gas at 58. Construction at 8.2 percent, trade at 5.1, agriculture at 3.7 and public administration at 3.3 all sit where you would expect them to.
Three do not. Manufacturing is negative. Net taxes are more negative still. And financial services, real estate, ownership of dwellings, IT and professional services, at 23.8 percent the largest single block in the economy, carries a deflator of half a percentage point.
A note on method before the next three sections, because the row has been conducted in shorthand. The old series mostly used single deflation, applying an output price index to each sub-sector's value added and assuming input and output prices moved together. The new series mostly does something else again: it deflates gross output using output prices and carries that growth rate across to value added, which assumes the input-output ratio holds. Double deflation, where inputs and outputs are deflated separately, is applied to manufacturing. Three methods, not two, and only one of them is at issue.
06 — Manufacturing
A negative deflator, checked against volumes
Manufacturing real GVA grew 9.17 percent while nominal GVA grew 7.68, which puts prices down 1.36 percent. Pronab Sen, India's first chief statistician, has said this can happen under double deflation and cannot happen under single. MoSPI's press note now says the same in its own words, noting that deflating output and intermediate consumption separately can push the implicit value-added deflator below zero when input prices climb faster than output prices.
The quarter supplies the conditions. Fuel and power wholesale inflation ran at 27.41 percent in June. Crude petroleum and natural gas output prices rose 58 percent. Input costs running well ahead of output prices is exactly the configuration that squeezes a value-added deflator and can invert it, and after section 03 we know the input block itself was revised upward when the series was rebuilt.
We cannot verify the deflator, because MoSPI publishes output producer prices by broad category and not the granular intermediate-consumption series the calculation consumes. So we tested the volume estimate it produces against a measure that needs no deflator.
Figure 3
Four readings of one quarter
Real manufacturing GVA growth, % YoY at constant (2022-23) prices, Q1 FY27, under different treatments of price.
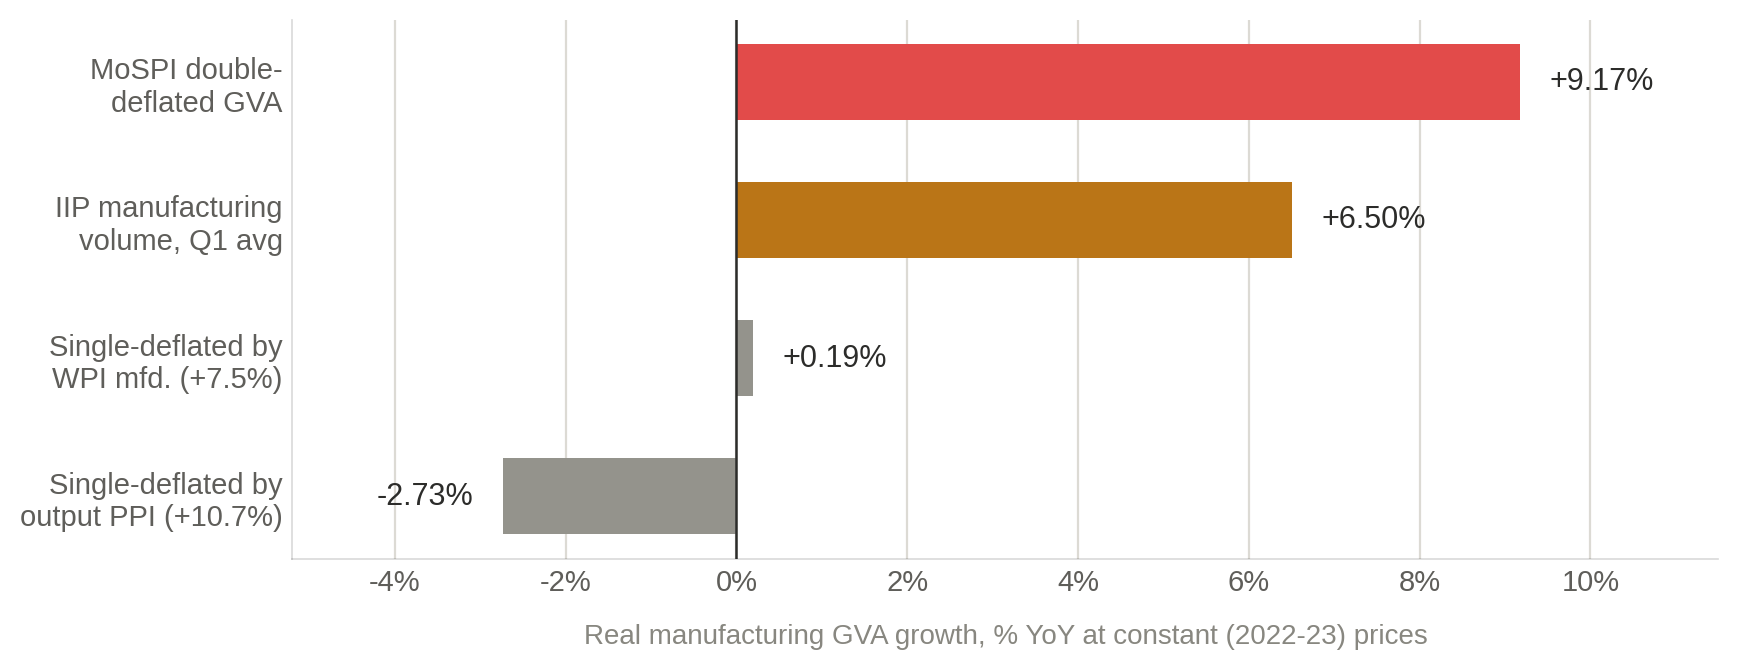
[Editor’s note] The MoSPI figure is published. The two single-deflation figures are Icarus Asia calculations applying the stated price index to published nominal manufacturing GVA; they illustrate what the old method would have produced and are not proposed corrections. The IIP figure is the simple average of published manufacturing IIP growth for April (6.2%), May (5.5%) and June (7.8%) 2026 under the 2022-23 base. IIP measures output volume and GVA measures value added, so the two are related without being equivalent. Sources: MoSPI Press Note Q1 2026-27; MoSPI IIP releases April–June 2026; PIB WPI and PPI release, June 2026.
The Index of Industrial Production counts units, not rupees. No deflator touches it. Manufacturing IIP averaged 6.50 percent across the quarter against MoSPI's 9.17 for manufacturing GVA, a gap of 2.67 points on a sector worth 12.4 percent of the economy.
That gap is not, on its own, evidence of mismeasurement, and it should not be read as one. IIP is a volume index of gross output weighted towards organised manufacturing. GVA measures value added. The two series are built to answer different questions, and under double deflation they can legitimately diverge, most of all when input prices rise faster than output prices, which is the configuration this quarter documents. A wedge between them is as consistent with both measures behaving as designed as it is with either being wrong.
Part of the gap also has a mundane explanation the ministry does not hide. Quarterly estimates for organised manufacturing still come off the earnings of listed companies, as they did in the old series. Listed firms are not the whole of Indian manufacturing, they skew large, and in a quarter when input costs moved unevenly their margins would widen faster than their output.
We use the IIP average in section 09 as an external check on the order of magnitude of the manufacturing contribution. It is one reasonable sensitivity among several, not a preferred figure, and not a correction we are proposing to the ministry's series.
Run the comparison the other way and single deflation looks worse. Deflate nominal manufacturing GVA by the output producer price index for manufactured products, which MoSPI puts at 10.7 percent for the quarter, and real manufacturing growth comes out at minus 2.73 percent. Use the June WPI for manufactured products and you get plus 0.19. Neither survives contact with an IIP growing 6.5 percent. The method India abandoned would not have produced a better answer here. It would have produced a differently wrong one.
What the rest of the dashboard says
Most of the high-frequency evidence supports a strong quarter. Auto sales rose 21 percent in August. Bank credit is running at a decade high of 19 percent. Net direct tax revenue rose more than 23 percent year on year across April to August. Cement, steel and vehicle output were all up between 12 and 16 percent on the ministry's own account, and none of those figures needs a deflator.
One indicator disagrees. The Purchasing Managers' Index, which is a survey rather than a count, has weakened to multiyear lows, with services near a four-year low in August. Raghuram Rajan, formerly governor of the Reserve Bank, put the same discomfort a different way, asking why strong growth has not shown up in job creation, domestic investment or foreign portfolio inflows. He later wrote on LinkedIn that he had neither questioned nor endorsed this quarter's numbers, and that his concern was the longer-run disconnect rather than any individual estimate. That distinction has been lost in most of the coverage and it is worth keeping.
07 — Net indirect taxes
The negative deflator that complicates matters
The largest negative deflator in the accounts is not in manufacturing. Net taxes on products fell 0.40 percent in nominal terms, from ₹7,76,644 crore to ₹7,73,502 crore, while growing 4.00 percent in real terms. That implies a deflator of minus 4.24 percent on a component worth 9.6 percent of GDP, three times the size of the manufacturing distortion everyone is arguing about.
It also has a dull explanation that has gone almost entirely unmentioned. India's GST rationalisation took effect on 22 September 2025, moving somewhere between 12 and 15 percent of goods out of the 12 and 28 percent brackets and into 5 and 18. Q1 FY27 sits wholly under the new rates. Q1 FY26, the quarter it is measured against, sat wholly under the old ones.
National accounts compute real net taxes by applying base-year effective tax rates to current volumes, so a rate cut registers as a negative price effect by construction. The accounts are working as designed.
Net taxes drag on the GDP deflator but not on the GVA deflator. So the GST cut makes real GDP growth look lower than real GVA growth, not higher. GVA grew 8.26 percent in real terms and GDP grew 7.85. Strip the tax effect out and the headline the government stands accused of inflating would have come in higher still.
One more piece of context belongs on the record. Take the FY2025-26 annual figures, published in May: real growth of 7.7 percent against nominal growth of 8.9 implies an annual GDP deflator of 1.11 percent. That is lower than this quarter's 2.31. Whatever has been compressing deflators in the new series has been doing it since February, and Q1 FY27's deflator is higher than the annual number that preceded it, which is difficult to reconcile with the idea that this quarter's deflator was chosen to flatter the result.
08 — Services
The sector doing the actual work
Financial services, real estate, ownership of dwellings, IT and professional services grew 12.12 percent in real terms and contributed 2.89 percentage points of the 7.85 percent headline. More than a third of India's growth this quarter came out of one line. Its implicit deflator is 0.52 percent.
Some of that defends itself. Ownership of dwellings, a large slice, is deflated by housing rent, which ran at 2.10 percent in June. IT and professional services carry a heavy export share, where rupee revenue turns on a currency that averaged 94.61 to the dollar over the quarter. Neither argues for a deflator anywhere near CPI.
Still, half a percentage point on the largest block in the economy, in a quarter when consumer inflation ran at 3.93 and the sector's own nominal growth was 12.70, is the single most consequential assumption in the release. It has attracted none of the scrutiny manufacturing has and it carries nearly twice the weight. Section 03 is relevant here too: real estate and professional services were among the sectors whose intermediate consumption the rebasing revised up most.
The 2.0 percent substitution we run in section 09 sits between the published 0.52 and housing rent inflation of 2.10. It is a judgment, not a measurement, and it is applied to a block that is not one thing. Ownership of dwellings may reasonably track rent. Financial intermediation, IT services and professional services would each warrant different treatment, whether through wage indices, sector-specific producer prices, or volume indicators where any exist. Applying a single deflator across the whole block is a simplification we adopt because published data supports nothing finer, and the resulting 0.39 percentage point effect on the headline should be read with that limitation attached rather than as a better number.
Nor can we test it the way we tested manufacturing. Services have no IIP. There is no volume index for legal advice or for bank intermediation. Quarterly service-sector growth in the new series leans on GST data, which is the same tax base the September 2025 rate cut reshaped, so the input to the estimate and the distortion in section 07 are not unrelated. This is the part of the release that cannot be checked from outside at all.
09 — The estimate
How much the price assumptions matter
Nominal growth of 10.33 percent is not seriously contested. Sen has said the 10 percent nominal figure is probably about right, and nothing in the tax, credit or output data we checked argues with him. The whole dispute reduces to one question: what price change do you take out of it?
The exercise below holds volumes and nominal figures exactly where MoSPI published them and varies only the deflator treatment of the two components for which an independent check is weak or absent. Every row is a sensitivity. None is a correction, and none is a claim that the ministry's own treatment is the wrong one.
Figure 4
The headline under alternative deflators
Real GDP growth, % YoY at constant (2022-23) prices, Q1 FY27. Only the deflator treatment changes; nominal values are MoSPI's throughout.
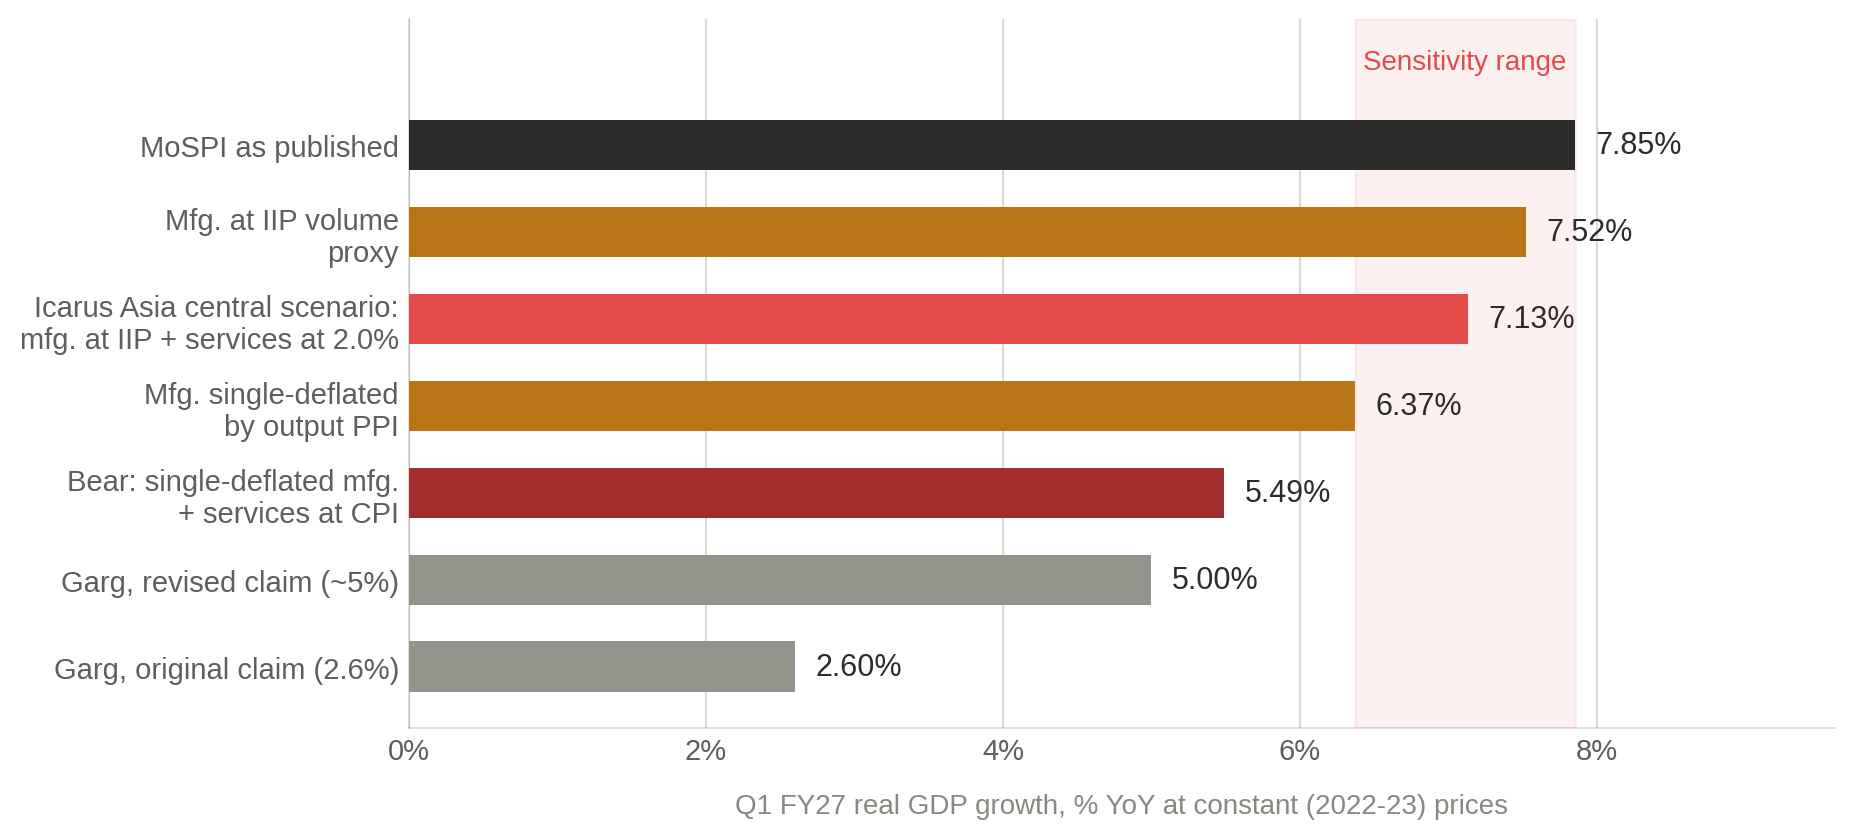
[Editor’s note] Every scenario except the two labelled Garg is an Icarus Asia calculation. Each holds MoSPI's published nominal growth and sector weights constant and substitutes only the stated deflator. The central scenario substitutes the IIP volume average for manufacturing and lifts the financial, real estate and IT deflator to 2.0%, between published housing rent inflation (2.10%) and the sector's published 0.52%. Both substitutions are judgmental: IIP measures gross output volume rather than value added, and 2.0% is applied across a heterogeneous block for which no volume index exists. Sections 06 and 08 set out the limits of each. Garg's figures are his stated public claims of 2.6% and approximately 5%, reported by NDTV and OpIndia respectively, shown for reference; neither is reproducible from the official tables by any method we could construct. Sources: MoSPI Press Note Q1 2026-27; MoSPI IIP and CPI releases April–June 2026.
| Scenario | What changes | Real GDP growth % YoY, constant 2022-23 prices | Delta pp |
|---|---|---|---|
| MoSPI as published | — | 7.85% | — |
| Manufacturing at IIP volume | Mfg. real 9.17% → 6.50% | 7.52% | −0.33pp |
| Services deflator at 2.0% | Fin./RE/IT real 12.12% → 10.49% | 7.46% | −0.39pp |
| Icarus Asia central scenario | Both of the above | 7.13% | −0.72pp |
| Manufacturing single-deflated | Mfg. real 9.17% → −2.73% | 6.37% | −1.48pp |
| Bear case | Single deflation + services at CPI | 5.49% | −2.36pp |
Table 2. Icarus Asia scenario model. Sector weights and nominal growth rates are held at MoSPI's published values in every row; only the stated deflator changes. These rows illustrate sensitivity to assumptions that published data cannot verify. They are not estimates of Indian GDP growth and imply no view that the published series is in error. The central scenario combines the two substitutions in the rows above it and inherits the limitations of both. The bear case is a lower bound rather than a view; reaching it means accepting a single-deflation manufacturing estimate that the IIP itself contradicts.
The central scenario of 7.13 percent falls close to the 7.1 percent analysts expected in a Reuters poll before the release. That is a coincidence and should be read as one. The poll was forecasting the published series rather than adjusting it, the two figures are assembled from different inputs, and agreement between two constructions carries no information about whether either is right. Morgan Stanley and Citi have the full year to March 2027 at 7.3 percent.
Where this leaves the level
Q1 FY27 GDP at current prices was ₹88.27 lakh crore, about US$933 billion at the quarter's average rate of 94.61. At constant 2022-23 prices the published figure is ₹81.36 lakh crore. The central scenario implies ₹80.82 lakh crore and the single-deflation manufacturing case ₹80.25 lakh crore.
So the level dispute is worth roughly ₹1.1 lakh crore in a quarter, around 1.4 percent of output. Worth arguing over. Some distance from the difference between an economy growing and an economy standing still.
Composition is the better argument, and it is the one Jaydeep Mukherjee of the Great Lakes Institute of Management has made: the quarter ran on a sharp rise in investment and stronger exports while household consumption improved only mildly, a mix he does not think holds. Anubhuti Sahay of Standard Chartered, who puts the improvement down to better methodology rather than base revisions, gets closest to where we come out. “It is not that the GDP number is only froth,” she said. The percentage can be debated. The direction cannot.
10 — What remains shut
The part that cannot be checked
Three things can be checked now that could not be a month ago. MoSPI has published output producer price indices by broad category. It has published a trial input producer price index. And the press note itself spells out the mechanism by which a manufacturing deflator goes negative, which the February release did not.
Five things still cannot.
- The input prices the calculation actually uses. Output PPI arrives by broad category. The granular intermediate-consumption weights and price relatives that double deflation consumes do not. So the manufacturing deflator can be explained, but not reproduced.
- Whether the new input PPI is in the numbers yet, because the public record contradicts itself. The statistics secretary told reporters on 2 September that the new series uses a more granular producer price index carrying more than 300 deflators for inputs and outputs, against roughly 180 before. The index MoSPI published in June is nonetheless labelled trial, and researchers tracking the series have written that it will be a while before input PPIs feed the national accounts. Both statements cannot be describing the same thing. Which one is right determines whether the manufacturing deflator rests on a validated price series or a provisional one, and nothing published settles it.
- The constant-price side of the supply-use framework. The new series uses supply and use tables to reconcile production against expenditure, which is the check Sen has argued India lost when it stopped compiling the tables. But reconciliation has been applied only to current-price estimates so far, because constant-price reconciliation needs item-wise input and output price data that is still missing for many sectors. The one part of the accounts that is not reconciled is the price side, which is the part this note has spent ten sections on. Under the old approach, discrepancies between the production and expenditure measures were published and attributed to whichever estimate was weaker. The new framework closes them instead.
- Why intermediate consumption rose so much. Sood's five candidate explanations, from better administrative visibility to procurement inefficiency to related-party billing, cannot be told apart from published data. They carry very different implications for whether the revised economy is better measured or worse run.
- The services deflators. No volume index exists to test the sector contributing 2.89 of the 7.85 percentage points.
Gita Gopinath, the IMF's former chief economist and first deputy managing director, was asked about India's methodology at Davos this year by India Today's Rajdeep Sardesai. “When I was chief economist of the IMF, we used to ask ourselves this question all the time, and the truth is, for pretty much most emerging and developing countries of the world they would get close to a C-grade on their national account statistics,” she said. “We didn't see any smoking gun evidence that there was something particularly bad about India's GDP numbers versus any other countries.” Reema Bhattacharya of Verisk Maplecroft puts the residual problem plainly: India's data leans heavily on formal-sector corporate filings while a large informal economy has to be estimated, and the gap between the two is where public scepticism lives.
MoSPI's press note says the full Sources and Methods publication is scheduled for release by September 2026. As of 12 September we could not confirm it has appeared. Until it does, this note is close to the limit of what outsiders can do: the addition verifies, the deflators can be pushed against independent volume and price data, and one component stays shut.
Appendix A
Analyst note
Method. We took sectoral GVA at constant and current prices and net taxes on products from MoSPI's Press Note on GDP Estimates for Q1 2026-27 (31 August 2026) and summed them to reproduce GDP. Implicit deflators are the ratio of nominal to real growth factors for each component. Scenario cases hold published nominal growth and constant-price sector weights fixed and substitute one deflator at a time, so every row in Table 2 differs from the published figure only in the assumption named.
Precision. Constant-price sector values were available to two decimal places in lakh crore, current-price values to the crore. Our reconstructed constant-price GDP total is therefore good to roughly ±0.05 percentage points, which accounts for the 7.85 against 7.8. MoSPI's own expenditure-table totals, read to the crore, give 7.82 percent real and 10.33 percent nominal growth, confirming that the gap is a rounding artefact of the sector-level read and not a discrepancy in the ministry's figures. Production-side contributions and all scenario rows are computed on the sector-level base for internal consistency.
Cross-checks. Manufacturing IIP (2022-23 base) for April, May and June 2026; CPI (2024=100) for the same three months; WPI and output PPI (2022-23 base) for June 2026 and the quarter; the FY2025-26 provisional annual estimates; the GST rate change effective 22 September 2025; SIAM dispatch volumes for April to June 2026; the published expenditure-side accounts for the same quarter; the Data for India explainer on the 2022-23 series; and Anil Sood's line-by-line reading of the revised National Accounts Statistics for the intermediate-consumption analysis in section 03.
What we did not do. We did not try to re-derive the double-deflated manufacturing series, because the input price data it needs is not public. We did not forecast FY27. We revised no volume estimate; every scenario here accepts MoSPI's nominal figures in full. The range in Table 2 is a sensitivity test of two assumptions we cannot verify, not a competing estimate of Indian GDP, and the central scenario within it is not a point forecast. Section 03 reports Sood's findings and his framing of the open questions; the inference drawn from them, that a larger intermediate-consumption block makes every real growth rate more fragile, is ours.
Appendix B
Primary sources
Ministry of Statistics and Programme Implementation. Press Note on GDP Estimates for Q1 2026-27. 31 August 2026. Statements 1 and 3 for production-side value added; statements 2 and 4 for the expenditure side and the discrepancies line; annexure for output producer price indices. mospi.gov.in
Ministry of Statistics and Programme Implementation. Press Note on GDP Estimates for Q4 2025-26 and Provisional Estimates, FY 2025-26. mospi.gov.in
Press Information Bureau. Provisional Estimates of Wholesale Price Index, Output Producer Price Index, and Trial Input Producer Price Index for the Month of June 2026. pib.gov.in
Press Information Bureau. Press Release of Consumer Price Index on Base 2024=100 for June 2026. pib.gov.in
Press Information Bureau. India's Index of Industrial Production Records Growth of 7.3% in June 2026. pib.gov.in
Society of Indian Automobile Manufacturers, dispatch data for April to June 2026, as reported. inkl.com — source for the passenger vehicle, two-wheeler, three-wheeler and commercial vehicle dispatch volumes in section 04. Figures are dispatches from manufacturers to dealers, not retail sales.
NielsenIQ. “GST 2.0 transition reshapes India's FMCG growth landscape.” nielseniq.com — source for the October to December 2025 FMCG volume figures cited in section 04 as the most recent sector-wide read available at our data cutoff. No aggregate FMCG volume series for April to June 2026 was available.
Whalesbook. “FMCG sector starts FY27 with strong growth, urban demand rises.” whalesbook.com — source for the reported June-quarter revenue of Hindustan Unilever, Dabur and Britannia. Company revenue, not sector volume.
Sood, Anil K. “Data Dive: GDP revision and what it reveals about how India produces.” The South First, 10 September 2026. thesouthfirst.com — source for the intermediate-consumption, capital-consumption and compensation findings in section 03.
Sood, Anil K. “7.8% GDP growth, 3% smaller economy: Does PM Modi's herculean feat add up?” The South First, 3 September 2026. thesouthfirst.com — source for the ₹43.86 lakh crore four-year revision.
Batra, Shubham. “Explainer: Why India's strong GDP growth is raising eyebrows.” Reuters, 3–4 September 2026. reuters.com — source for the Reuters poll consensus, the statistics secretary's 300-deflator and 2.3% deflator remarks, the Rajan remarks and his LinkedIn clarification, the ICICI and Societe Generale readings, and the high-frequency and PMI figures.
Salve, Priyanka. “India's June quarter GDP print is courting controversy. Here's why.” CNBC, 4 September 2026. cnbc.com — source for the IMF C-grade report and its three named faults, the Nageshwaran and Garg remarks, and the Bhattacharya, Sood, Sahay and Mukherjee comments.
Data for India. How India Measures GDP. dataforindia.com — source for the ₹7.7 lakh crore base-year revision, the corporate-sector and consumption revisions, the IMF working-paper comparison of 78 rebasing economies, the three deflation methods, the supply-use reconciliation status, the quarterly compilation sources, and the SNA 2008 quotation.
Business Today. “At Davos 2026, Gita Gopinath was asked about India's GDP data methodology. Her response.” 3 September 2026. businesstoday.in
Business Today. “The GDP conundrum: Economists split over India's faster than expected 7.8% GDP growth rate.” 2 September 2026. businesstoday.in — source for the Basu and Subramanian remarks.
Photograph. Morten Ross, ross.no, used under Creative Commons Attribution 4.0 International (CC BY 4.0).
Republic World. “India IIP Growth Hits 4.9% In April 2026 As MoSPI Revises Base Year To 2022-23.” 1 June 2026. republicworld.com — April 2026 manufacturing IIP of 6.2%.
Business Standard. “Tax turbulence: Revenues take a hit in first full month of GST 2.0.” 1 December 2025. business-standard.com — GST effective date and bracket migration.
Business Today. “FY26 real GDP seen at ₹322.58 lakh crore as new base year projects 7.6% growth.” 27 February 2026. businesstoday.in
X-Rates. Monthly average USD/INR, April to June 2026. x-rates.com — a commercial aggregator rather than a central bank reference rate, so the US$933bn conversion is approximate.
Public statements by Subhash Chandra Garg, Saurabh Garg, V. Anantha Nageshwaran, Neelkanth Mishra, Sanjeev Sanyal, Surjit Bhalla, Montek Singh Ahluwalia, Kaushik Basu, Krishnamurthy V. Subramanian, Raghuram Rajan and Pronab Sen are as reported in the wire and print coverage cited above and in the accompanying feature. This note draws no analytical conclusion from any of them that is not independently derived from the statistical releases.
Credit & Macro Research · 12 September 2026 · India Macro
This note reconstructs published official statistics and tests them against other published official statistics. It contains no non-public information. Figures identified as Icarus Asia calculations are derived by the author from the sources listed in Appendix B and are not official estimates of any statistical agency. The scenario range in Table 2 is a sensitivity analysis of the deflator assumption, not a forecast of Indian GDP. Currency conversions use a commercial aggregator's monthly average rate and are approximate. This document is research, not investment advice, and is not an offer or solicitation to buy or sell any security.