

Japan's Savings
Start to Stay Home
The Bank of Japan's September hike was priced, and markets read it as dovish. The effects on global yields, yen carry and risk assets run through slower channels.
Priced in, with the effects still to come
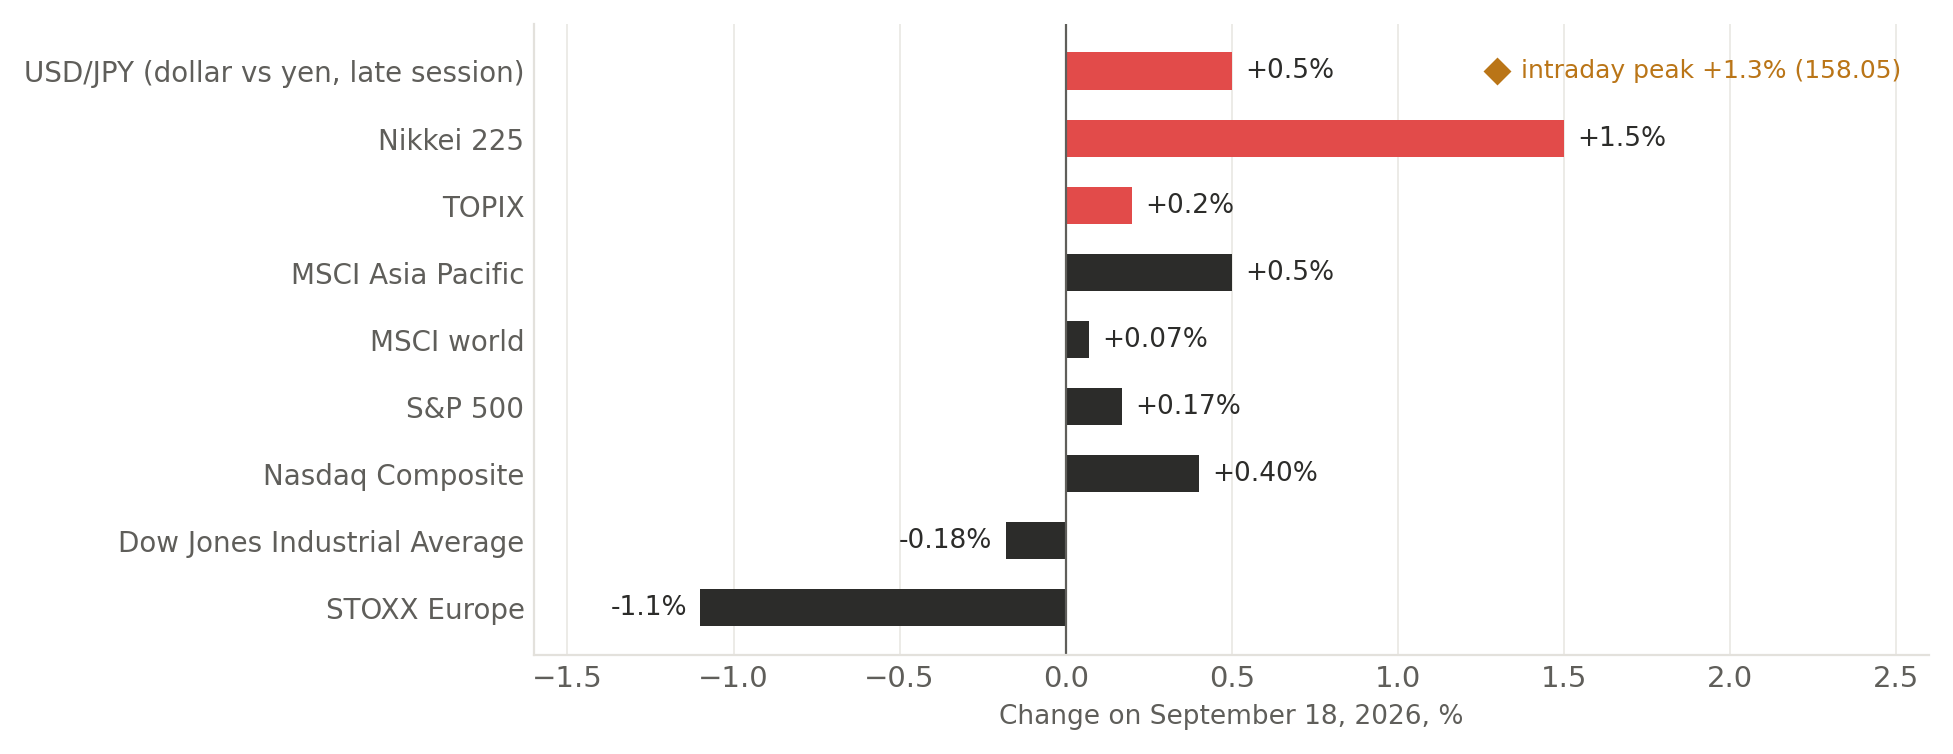
The Bank of Japan (BOJ) voted 7–2 on September 18 to raise its overnight call-rate target to around 1.25 percent from around 1.0 percent, effective September 24. Reuters called it a 31-year high. Investors had expected the move and took the two dissents as a sign that the next one would come slowly: the dollar touched 158.05 yen before paring its gain, the 10-year Japanese government bond (JGB) yield fell about 4.9 basis points to 2.947 percent, and the Nikkei 225 rose about 1.5 percent.
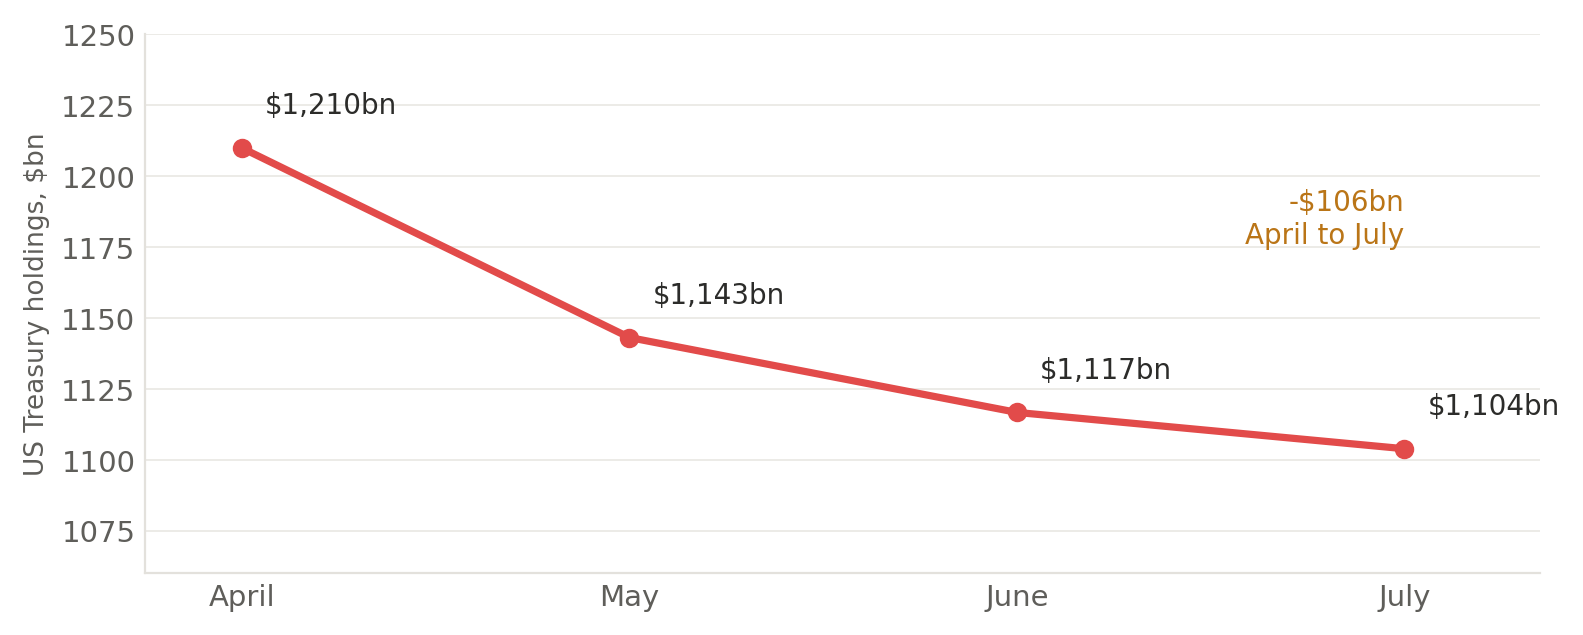
The lasting effect will come through bond demand. Higher JGB yields let Japanese pension funds and insurers meet return targets with less overseas duration, so fewer of them bid for Treasuries, Australian government bonds and European sovereigns at the margin. Japan held about $1.1 trillion of US Treasuries in July, the latest month in the Treasury's custodial (TIC) data. TIC records where securities are held, so it cannot always identify the owner or separate sales from price changes. Even so, Japan remains the largest foreign holder, and its position is about $106 billion below April. A J.P. Morgan Asset Management survey of 82 Japanese corporate pension funds found the highest net share since 2008 planning to add domestic bonds. Mandates change at scheduled reviews, so the shift arrives as smaller purchases rather than forced sales.
Yen carry is the fast channel. Cross-border yen borrowing reached a record ¥360 trillion, about $2.35 trillion, by March 2026 in a Jefferies analysis of Bank for International Settlements (BIS) data. That is a broad funding measure, and no source we found says how much of it is exposed to a fast yen rally; the only carry-specific estimate is the BIS's roughly ¥40 trillion for 2024. The BIS found that a hawkish BOJ hike and weak US jobs data were amplified in August 2024 by leverage, margin calls and thin liquidity: TOPIX fell 12 percent in a day and the VIX briefly topped 60. September went the other way, but a calm reaction to an expected hike invites traders to rebuild short-yen positions, and the BIS saw signs of that after 2024.
We place September closest to an orderly normalization: somewhat higher global yields, wider dispersion across equities and emerging markets, and no systemic unwind. A disorderly outcome needs several things at once: faster BOJ tightening, a sharp yen rally, weak global growth and crowded positioning. The September reaction went against the first two, but the BOJ says it will keep raising rates. A risk-off episode would also slow repatriation, because falling US and European yields widen the yield advantage of foreign bonds over JGBs again.
The September hike is largely a non-event for global risk assets, a view that the dovish reading of the 7–2 vote and the weaker yen support.
The larger change is Japan's slow retreat as a dependable buyer of foreign duration. That lifts the floor under global term premia and removes a long-standing subsidy to leveraged strategies.
Our read favors assets and strategies that tolerate higher term premia and occasional yen-driven volatility, and argues for less exposure to the most crowded, highest-duration and most yen-funded positions. Japanese banks and selected domestic-value shares look like relative beneficiaries.
The dangerous case is a faster BOJ path, a rapid yen appreciation and a global growth scare arriving together. No single 25 basis point move produces it, and falling US and European yields in a risk-off phase would slow Japanese repatriation.
A 25-basis-point hike, 7–2
The board voted on September 18 to guide the uncollateralized overnight call rate to around 1.25 percent, up from around 1.0 percent, effective September 24. The complementary deposit facility rate, the basic loan rate and the statutory basic discount rate moved with it, as Table 1 shows, and the board unanimously changed loan terms on several funding operations.
Governor Kazuo Ueda, Deputy Governors Ryozo Himino and Shinichi Uchida, and board members Hajime Takata, Naoki Tamura, Junko Koeda and Kazuyuki Masu voted in favor. Toichiro Asada dissented. Core consumer price index (CPI) inflation, which excludes fresh food, had recently run below 2 percent, and he judged that economic strength was not assured, so he preferred to keep the old guideline. Ayano Sato also dissented: in her judgment, economic and price developments had not accelerated enough to justify a hike at this meeting.
Takata and Tamura objected from the other side, though only to the wording of the outlook report: each judged that inflation, underlying inflation included, was already broadly consistent with the 2 percent target.
| Item | Setting | Detail |
|---|---|---|
| Uncollateralized overnight call-rate target | Around 1.25% | Up from around 1.0%; effective September 24 |
| Complementary deposit facility rate | 1.25% | Eligible BOJ current-account balances, excluding required reserves |
| Basic loan rate (complementary lending) | 1.50% | Statutory basic discount rate also 1.50%; bill discounting suspended |
| Vote | 7–2 | Against: Toichiro Asada, Ayano Sato |
| Forward guidance | Further hikes | Pace and timing contingent on activity, prices and financial conditions |
The BOJ described the economy as having recovered moderately, with pockets of weakness and an impact from the Middle East situation, and expects moderate growth supported by government measures and rising global demand tied to artificial intelligence (AI), despite high crude prices. Producer prices are high, and wage and cost increases are passing into retail prices. The bank projected CPI excluding fresh food clearly above 2 percent from the second half of fiscal 2026, easing toward 2 percent later in the July forecast horizon, with underlying inflation consistent with the target between the second half of fiscal 2026 and fiscal 2027. It listed the Middle East, global AI demand and foreign-exchange moves as risks, and named the chance that underlying inflation overshoots 2 percent.
That guidance depends on economic activity, prices and financial conditions, and the BOJ said timing and pace would follow how closely the baseline and its risks play out. It added that financial conditions would remain accommodative after the hike, with real interest rates still low and corporate funding conditions favorable. By its own account, the September move tightens policy at the margin without making it restrictive.
A dovish reaction to a hawkish move
The dollar rose as much as 1.3 percent to 158.05 yen after the announcement, then gave back part of the gain on reports that Japanese authorities had conducted rate checks. Late in the global session it stood near 156.73 to 156.76, about 0.5 percent higher on the day. Bond yields moved with the currency. The 10-year JGB yield fell roughly 4.9 basis points to 2.947 percent and the two-year fell about 2.5 basis points to 1.835 percent. CNBC's headline said Japan's markets had flipped the usual script. Traders priced the two dissents and the missing signal for October; the hike itself was already in prices.
The Nikkei 225 gained about 1.5 percent, though sources put the gain between 1.38 and 1.70 percent depending on the timestamp. TOPIX rose only about 0.2 percent, a gap that points to a narrow rally weighted toward exporters and technology names, helped by the weaker yen and lower yields.
Elsewhere the moves were small (Figure 1). Fed policy, energy prices and sector rotation were all in play that day, so none of them isolates the BOJ.
Bitcoin's reading depends on the clock. CoinDesk had it near $76,900 and broadly steady just after the announcement. Reuters later reported a 6 percent gain to about $81,000 in the New York session, by which time global liquidity, oil and US risk sentiment had also shifted. We would not credit that move to the BOJ.
September shows why the sign of a rate move is a poor guide to its effect. Markets price the surprise and the expected path. A dovish hike delivers the expected increase and leaves the path less threatening, and September had those features even though the formal guidance points to further tightening.
The question for December
Analysts split on how much weight the two dissents deserved. TD Securities' Prashant Newnaha called the commitment to keep raising rates, together with the warning about upside inflation risk, hawkish, yet found no evidence pointing to an October move. HSBC's Fred Neumann said the statement and the dissents left doubt about the board's appetite for tightening quickly. He thought consecutive hikes unlikely but said the BOJ had to keep December open, particularly with the Federal Reserve also leaning hawkish.
Nomura's Naka Matsuzawa attributed the yen's decline to the dissents and argued the BOJ could hold the market's roughly quarterly pricing without naming October. Daiwa Securities' Yugo Tsuboi called the decision dovish: no 50-basis-point option had materialized, and the dissents made rapid acceleration harder to imagine. Less fear of over-tightening, he judged, supported equities.
Two other houses read the meeting as one step in a wider shift. Masahiko Loo of State Street Investment Management described Japan as part of a synchronized tightening cycle in which higher domestic yields keep more capital at home. The issue he sees is Japan gradually ceasing to be the marginal buyer of foreign assets, while existing holdings stay put. Invesco's David Chao made a related point about regimes: the BOJ was no longer an extreme outlier, with the BOJ, the Fed and the European Central Bank (ECB) all tightening in the same month.
Published forecasts cluster around a roughly quarterly rhythm. Goldman Sachs called the 25-basis-point move before the meeting and argued that a 50-basis-point hike, or hikes at both the September and October meetings, would need clearer evidence of inflation overshooting. Vanguard's international rates team sees 2 to 2.5 percent as a plausible neutral rate, above what markets were pricing at the time.
| House | Near term | Path beyond |
|---|---|---|
| TD Securities | Next 25 bp increase in December | Roughly quarterly |
| Goldman Sachs Research | 1.50% in January 2027 | 1.75% in July 2027 |
| Vanguard | 1.5% by end-2026 (two quarter-point rises in 2026) | 2% in 2027; neutral of 2–2.5% plausible |
As of September 21 we found no assessment of the decision from the International Monetary Fund (IMF). Its baseline is the April 2026 Article IV consultation and Global Financial Stability Report (GFSR), which backed gradual, data-dependent hikes toward a neutral rate and close monitoring of JGB market functioning, and which estimated that the BOJ's balance-sheet reduction would add about 9 basis points to JGB term premia in 2026.
From policy to portfolio
A rate rise in Tokyo reaches portfolios elsewhere by five routes (Table 3). The first three can hit within days if positioning is stretched; the last two work over quarters and years.
| Channel | Mechanism |
|---|---|
| 1. Funding cost | Yen borrowing costs more, which cuts the expected return on yen-funded positions. |
| 2. Exchange rate | If normalization lifts the yen, yen liabilities cost more to repay in foreign-currency terms. |
| 3. Leverage and volatility | Losses, higher margins and tighter value-at-risk limits force sales of otherwise unrelated assets. |
| 4. Portfolio rebalancing | Higher JGB yields make domestic bonds more attractive to Japanese banks, insurers, pension funds and households. |
| 5. Global discount rate | Less Japanese demand for foreign bonds lifts global term premia and lowers the present value of long-duration assets. |
A simplified return on an unhedged, yen-funded carry position shows why the first three channels interact:
Here (iA − iJPY) is the interest-rate differential, RA the local-currency return on the acquired asset, ΔsJPY the yen's appreciation against the asset currency, and C the combined transaction, hedging and financing costs. A BOJ hike raises iJPY directly. If it also lifts the yen or foreign-exchange volatility, several terms worsen at once, and the adjustment arrives as a jump.
The academic literature on carry trades predicts that asymmetry. Brunnermeier and co-authors (2008) found that high-interest-rate investment currencies show negatively skewed returns, because positions come off abruptly when risk appetite and funding liquidity fall, and that rises in the VIX coincide with carry losses. What matters is the interaction among exchange rates, leverage, margin requirements and volatility, and a 25-basis-point change in funding cost is a small part of it.
The Carry Trade's Realistic Figure
Nobody has a clean count of the yen carry trade. Positions sit in cash borrowing, futures, forwards, swaps, options, offshore securities and inter-office bank flows, so each statistic captures a slice, and the published figures differ by nearly an order of magnitude because they measure different things.
The BIS estimated carry exposures at roughly ¥40 trillion, or $250 billion, entering the August 2024 turbulence and warned that data gaps probably biased the figure down. It separately counted about ¥40 trillion of yen loans to nonbanks outside Japan and more than ¥80 trillion of cross-border yen bank claims on nonbanks in offshore centers. The Jefferies analysis of BIS data put total cross-border yen borrowing at a record ¥360 trillion, about $2.35 trillion, by March 2026.
How much of that ¥360 trillion is still exposed to a rapid yen rise? No source we found says. The total includes financing that has nothing to do with directional bets, and the leveraged, unhedged, volatility-sensitive slice is the hardest part to observe. For carry specifically, the BIS's roughly ¥40 trillion is the only published figure. It dates from 2024, and the BIS itself thought it low. We treat the vulnerable stock as unmeasured.
The cost of the shrinking subsidy is easier to size. Each 25 basis points on the overnight rate adds about ¥100 billion a year in interest on ¥40 trillion of yen funding, and about ¥900 billion on the full ¥360 trillion if all of it repriced with the overnight rate, which it does not. These are Icarus Asia's arithmetic bounds on carrying cost. They say nothing about losses from a yen rally, which arrive faster than interest costs do.
August 2024 is the nearest thing to an event study. A hawkish BOJ increase and weak US labor data landed together. TOPIX fell 12 percent in one day, the S&P 500 lost 3 percent on August 5, the VIX briefly rose above 60, and equities fell across Europe and Asia. Markets recovered quickly, which tells us the episode amplified a shock and did not reveal a deteriorating outlook. The BIS attributed the amplification to high leverage, thin August liquidity, rising margins and strategies built on low volatility. Initial margins at the Japanese clearing house rose 60 to 80 percent on long equity-index positions and 43 percent on short JGB-futures positions, which forced more selling. Among major high-yield currencies the Mexican peso fared worst, followed by the Brazilian real and the South African rand.
| August 2024 | September 2026 | |
|---|---|---|
| Backdrop | Hawkish BOJ increase, weak US labor data | Expected 25 bp hike; 7–2 vote with two dissents |
| Yen | Rose sharply | Dollar up to 158.05 yen intraday, about 156.7 late in the session |
| Japanese equities | TOPIX down 12% in one day | Nikkei 225 up about 1.5%; TOPIX up about 0.2% |
| US equities | S&P 500 down 3% on August 5 | S&P 500 up 0.17% |
| Crypto | Bitcoin and Ether down as much as 20% | Bitcoin near $76,900 after the announcement; reported near $81,000 later in the day |
Before this meeting, Reuters reported on September 8 that the yen had gained 4.5 percent in a week and that three-month USD/JPY implied volatility had recorded its largest weekly rise in two years. Analysts quoted there warned that residual yen shorts could feed a self-reinforcing unwind if appreciation triggered stops and deleveraging. The hike, read as dovish, pushed the yen the other way and took the acute risk down. Structurally, nothing changed: each further hike narrows the carry, and a sudden yen rally hurts leveraged holders more than proportionally.
A calm reaction carries a cost of its own. The BIS found leveraged positions being rebuilt soon after the 2024 turbulence and concluded that only part of the low-volatility, cheap-yen trade had been unwound. Low volatility after an expected hike may postpone tail risk without removing it.
Where the money goes from here
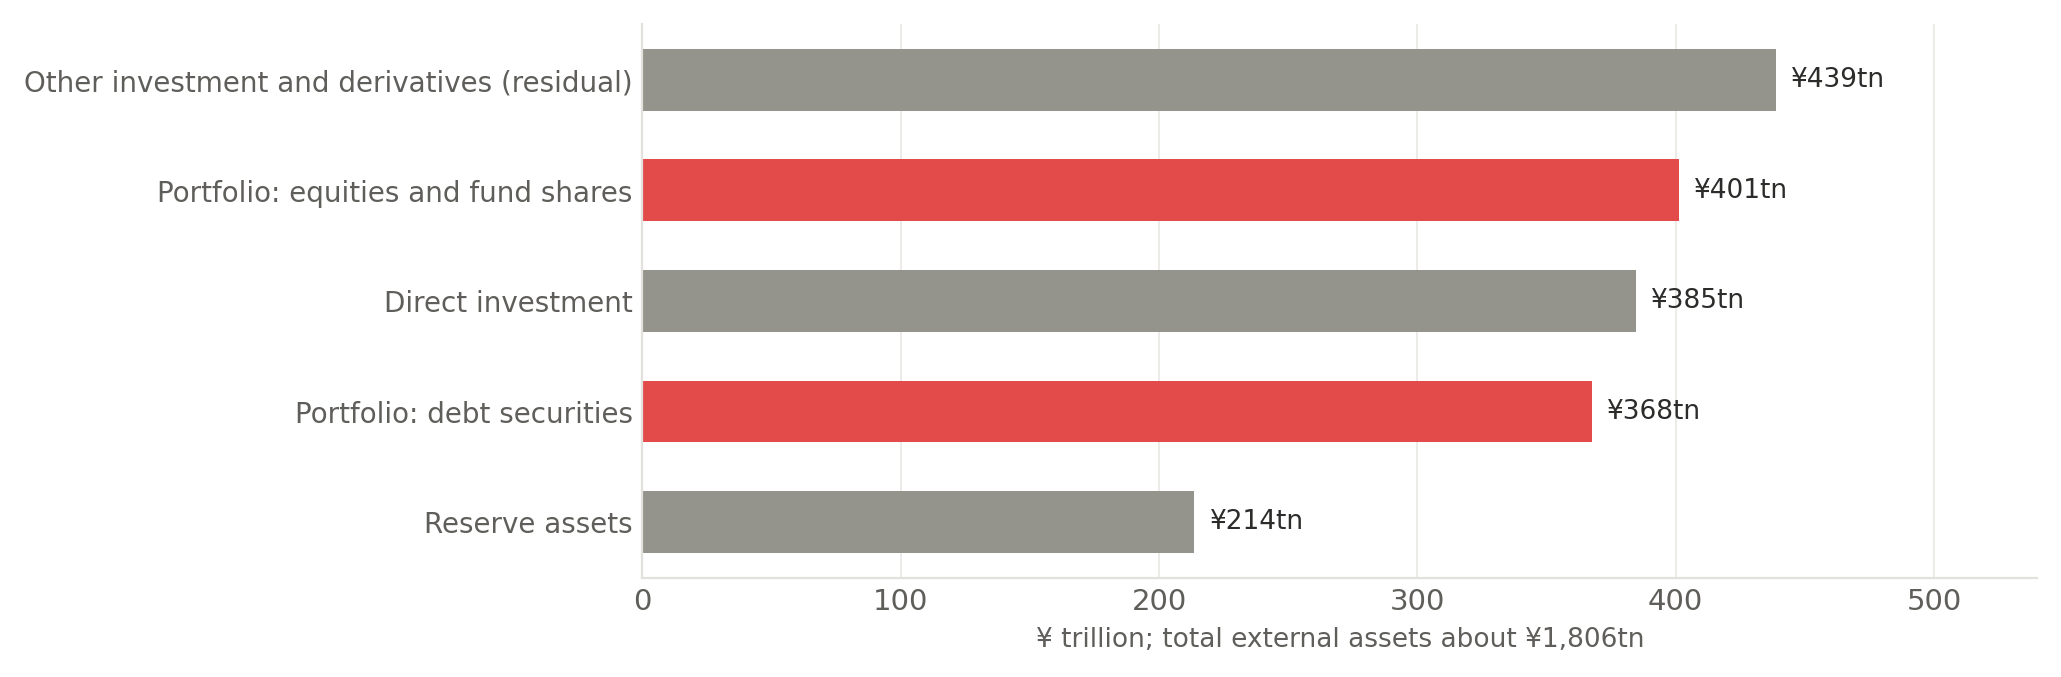
Japan's international investment position gives the scale. At the end of 2025 external assets stood at about ¥1,806 trillion against liabilities of about ¥1,244 trillion, leaving net assets of about ¥562 trillion. Outward portfolio assets, the part most open to reallocation, came to about ¥769 trillion: roughly ¥401 trillion in equities and fund shares and ¥368 trillion in debt securities. The IMF put Japan's net foreign assets at $3.7 trillion in the third quarter of 2025 and its 2025 current-account surplus at 4.8 percent of gross domestic product (GDP).
Treasuries are the visible test. Japan held about $1.10 trillion in July, still the largest foreign holder, down from about $1.21 trillion in April, a fall of about $106 billion, with a decline in each of the three months since. TIC compiles holdings from US custodians and broker-dealers, so it cannot always identify the ultimate owner or separate valuation changes from sales. July was the latest month published, and August country data had not been released by September 21.
Flow data need more care than holdings data, because the sources disagree and cover different things. The Ministry of Finance (MOF) series counts Japanese debt securities and not JGBs alone, and only designated reporting institutions. Reuters applies its own classification, and the Japan Securities Dealers Association (JSDA) splits flows by maturity. On the MOF series, nonresidents were net sellers in August 2026 of about ¥0.7 trillion of long-term debt and about ¥5.0 trillion of short-term debt. On Reuters' broader count, foreigners were net buyers of about ¥3 trillion of Japanese fixed income in August and about ¥18 trillion over the six months to August. The two August readings disagree in sign, and we would lean on neither.
The longer record is clearer. Nonresidents bought a record ¥13 trillion net of long-dated Japanese bonds in 2025, about 53 percent of all new purchases and the most since comparable data began in 2005, according to the IMF, and they held roughly 13 percent of JGBs in the latest MOF snapshot. JSDA data for July show net foreign sales in two- and five-year debt and net purchases beyond ten years. Any claim about foreign JGB flows means little until it names its source, instrument and maturity.
The flow runs both ways, and that matters for markets. Foreign buying of JGBs can support the yen and tighten conditions for yen-funded positions, while Japanese institutions buying fewer foreign bonds can raise yields abroad.
On the domestic side, the J.P. Morgan Asset Management survey found the highest net share planning to add domestic bonds since it began in 2008, and funds are still cutting overseas debt because currency-hedging costs are high. J.P. Morgan Private Bank expects structural upward pressure across the JGB curve, with normalization supporting shorter yields and higher term premia pressing the long end. Life insurers own 15.8 percent of the JGB market but have been buying less, especially at super-long maturities, because volatility creates balance-sheet risk they do not want. Higher yields lift their reinvestment income but cut market values and add solvency volatility, so their recent pattern has been to swap low-coupon domestic bonds into higher-yielding JGBs. Nippon Life planned about ¥3 trillion of such rotation after about ¥2 trillion in the prior fiscal year, according to the IMF. Pension and insurer behavior plays out over quarters and fiscal years, tied to mandate reviews and annual investment plans.
Our reading of the sequence: smaller overseas reinvestment first, then selective sales of hedged foreign bonds, then larger domestic allocations as mandates come up for review, and broad repatriation last, if it comes at all. The IMF regards abrupt reallocation as unlikely because Japanese institutions hold substantial capital and liquidity buffers and the BOJ owned 51 percent of outstanding JGBs as of June 2025, which limits forced domestic selling. That supports a lasting term-premium effect and argues against reading one BOJ hike as the start of a large liquidation.
The IMF's April 2026 stability analysis named the United States, Australia and several euro-area markets as the most exposed, since Japanese investors hold large shares there, and found that BOJ policy shocks spill over most strongly into foreign sovereign yields where Japanese participation is larger. Vanguard frames the result as Japan becoming a competitor for global capital: higher JGB yields keep more savings at home and push long-term global yields up when sovereign, corporate, AI and defense financing needs are already heavy. The effect is hard to isolate from synchronized global tightening, fiscal issuance, quantitative tightening, oil-driven inflation and AI financing demand.
Asset-class sensitivities
| Asset class | Immediate sensitivity | Time horizon | Mechanism | Direction |
|---|---|---|---|---|
| High-duration equities | High | Days to months | Higher global real yields and deleveraging cut valuation multiples | Negative, most where earnings duration is long |
| Broad developed equities | Moderate | Months | Discount-rate pressure partly offset by stronger nominal growth | Mildly negative to neutral in an orderly path |
| Japanese equities | High but mixed | Days to months | Stronger yen hurts exporters; higher rates help bank margins; domestic reflation supports cyclicals | Rotation from exporters and long-duration growth toward banks and domestic value |
| Investment-grade credit | Moderate | Months to quarters | Higher government yields lift all-in borrowing costs; strong balance sheets limit spread damage | Modestly negative through duration |
| High-yield and leveraged credit | High | Days for liquidity; quarters for refinancing | Refinancing costs, thinner liquidity and wider risk premia interact | Negative, especially for weak free-cash-flow issuers |
| Emerging-market local debt and FX | High | Days to months | Carry compression, yen-funded deleveraging and higher global yields | Negative for crowded high-yield currencies and externally vulnerable issuers |
| Private equity and private credit | Delayed but material | Several quarters to years; timing set by appraisal cycles, refinancing dates and exit windows | Higher discount rates, weaker exit multiples and refinancing pressure | Negative with a lag; marks may adjust more slowly than public markets |
| Japanese life insurers and pension funds (as buyers of foreign bonds) | Low | Quarters to years; follows mandate reviews and fiscal-year plans | Higher JGB yields draw reinvestment home; hedged foreign bonds are sold first | Fewer purchases of foreign duration; broad repatriation unlikely near term |
| Cryptoassets | Very high, tactically | Hours to days | Leverage and 24-hour trading make crypto a source of cash in margin stress | Volatility-negative; direction depends on the broader liquidity regime |
| Commodities | Mixed | Days to months | Financial deleveraging is negative, while supply and inflation shocks may dominate | Industrial commodities vulnerable; gold can benefit after initial liquidation |
Global equities feel the discount rate first. If higher JGB yields draw Japanese money out of foreign bonds, sovereign yields and term premia rise abroad, which raises the cost of equity and cuts the present value of distant cash flows. A high-frequency study of Japanese policy announcements found that unexpected tightening lowers Japanese stock returns and lifts government-bond yields, more so at longer maturities. Growth and technology shares are the most exposed, both because their value sits in far-off cash flows and because liquid mega-caps get sold first when investors need cash. A decline of about $1 trillion in AI and technology valuations in July and August 2024 preceded the acute unwind. When the BOJ tightens because wages, demand and inflation are strengthening, it also sends a growth signal, and that offsets part of the discount-rate effect. Inside Japan, September's rally alongside a weaker yen shows that the currency and the perceived policy path can outweigh the mechanical effect of the rate.
Investment-grade credit takes its hit through duration: higher risk-free yields lift all-in borrowing costs, with long-dated bonds and frequent issuers the most exposed, while spreads may hold if growth does. High-yield bonds, leveraged loans and collateralized loan obligations (CLOs) face a worse asymmetry. Cross-border yen claims on offshore nonbanks have financed structures including US CLOs, which ties yen funding to credit-market liquidity, so a volatility shock can widen spreads through dealer balance sheets, hedge-fund leverage and forced sales before default rates change. A BOJ hike does not cause defaults. It can raise refinancing costs and set off a liquidity repricing, and weaker earnings or a US recession would compound the two.
The clearest potential losers from a disorderly unwind sit in emerging markets. Academic work on the BRICS economies finds stronger lower-tail dependence between carry returns and equity returns during crises. The IMF's 2026 analysis found emerging-market portfolio flows increasingly weighted toward carry-driven debt and hedge funds more sensitive to emerging-market carry. Exposure depends less on the level of a country's policy rate than on crowded foreign positioning, weak external balances, dependence on imported energy, shallow markets and limited policy credibility. Countries with strong current accounts, credible inflation policy, adequate reserves and little foreign-currency debt should see only temporary outflows. In an orderly normalization the outcome is wider dispersion across emerging markets rather than indiscriminate selling.
Private assets respond with a lag, because appraisals set the marks and financing is often fixed for a period. The economics resemble long-duration public equity and below-investment-grade credit, and steady marks are no evidence of immunity: a sustained rise in sovereign yields cuts transaction volumes, widens bid-ask gaps and delays exits, and floating-rate borrowers, highly levered buyouts and refinancing-dependent strategies face the greatest risk.
Cryptoassets are a tactical case. They trade around the clock, often carry embedded leverage and can be sold when other markets are shut. The 2024 losses of up to 20 percent came from cross-margin liquidation with no direct link to Japanese rates, and September 2026 did not repeat them: Bitcoin was reported higher later that day as the yen weakened and the split vote eased fears of a quick follow-up (section 02 explains why we do not attribute that to the BOJ). Direction depends on the policy surprise, the yen, leverage and global sentiment.
Five developments to monitor
| Scenario | Policy and FX configuration | Cross-asset result | Icarus Asia assessment |
|---|---|---|---|
| Orderly normalization | Gradual, communicated BOJ increases; stable or gently appreciating yen; resilient global growth | Modestly higher global yields, greater equity dispersion, controlled emerging-market outflows, no systemic unwind | Baseline |
| Dovish pause | Inflation moderates; BOJ delays follow-up increases; yen stays weak | Carry rebuilds and high-beta assets rally, while future crowding and crash risk grow | Plausible |
| Hawkish repricing | BOJ signals a faster path or higher neutral rate; yen appreciates rapidly | Long-duration equities, high-yield FX, crypto and leveraged credit sell off; volatility rises | Material tail risk |
| Global-growth shock | Weak US and global data coincide with BOJ tightening and yen strength | Severe carry unwind; sovereign yields may fall at first on flight to quality even as risk spreads widen | Highest-impact tail risk |
| Inflation and term-premium shock | Japanese and global inflation stay high; JGB and foreign yields rise together | Simultaneous equity and bond losses; credit conditions tighten; diversification weakens | Material medium-term risk |
September fits the orderly-normalization row better than the shock rows: the hike was expected, the yen weakened and risk assets absorbed it. The BOJ's stated intention to keep raising rates has still shifted the distribution of outcomes, since markets now have to price a higher chance that Japan's real rate, domestic yields and exchange rate converge on less exceptional levels.
The worst configuration needs the BOJ to tighten, the yen to rise, global growth to weaken and leverage to be crowded, all together. In August 2024 weak US labor news and a hawkish reading of the BOJ jointly triggered the reassessment, and leverage and margins amplified it. In a pure global-inflation scenario the yen might not strengthen enough to force a carry crash, but higher global term premia could still depress bonds and equities at once.
Stabilizers exist, and they matter for sizing the tail. A risk-off episode lowers US and European yields, which widens the yield advantage of foreign bonds over JGBs again and slows Japanese repatriation at the moment markets most need buyers. It can also push the BOJ toward more cautious communication. The quick recovery after August 2024 suggests that markets and policymakers can interrupt a deleveraging spiral before it turns systemic.
| Indicator | What to look for |
|---|---|
| USD/JPY level and speed | Rapid yen appreciation is more destabilizing than a slow trend, because it raises the foreign-currency value of yen liabilities. |
| Yen implied volatility and risk reversals | Higher volatility lowers carry-to-risk ratios and can trigger value-at-risk reduction before spot moves get extreme. |
| Japan–US rate differentials | Narrowing real and nominal differentials weaken the case for short-yen funding. |
| JGB curve and term premium | A bear steepening led by super-long maturities raises the incentive for domestic reallocation. |
| Japanese purchases of foreign securities and Treasury holdings | Weekly and monthly MOF flows and monthly TIC holdings separate actual repatriation from narrative. The August TIC release is next. |
| VIX, MOVE and margin requirements | A joint rise signals that leverage and funding constraints may turn a valuation adjustment into forced deleveraging. |
| Emerging-market carry-to-volatility and fund flows | Deterioration flags markets where nominal carry no longer pays for FX and liquidity risk. |
| Cross-asset correlation | Simultaneous losses in equities and sovereign bonds cut hedging capacity and raise the odds of procyclical selling. |
Neutral now, more volatile later
We read the September hike as largely a non-event for global risk assets in the near term and the process behind it as a source of higher volatility over a longer horizon. The expected 25 basis points were absorbed, and the split vote led markets to a dovish reading. Yen funding is getting more expensive, JGBs are becoming competitive with foreign assets, and Japan's savings surplus can no longer be assumed to hold global yields down.
Investment-grade credit and broad developed-market equities should hold up better under orderly normalization, and Japanese banks and domestic-value shares may benefit even as exporters face currency risk.
September's opposite reaction rules out any mechanical link between BOJ hikes and global sell-offs. The claim the evidence does support is narrower: normalization removes a long-standing subsidy to leverage and makes asset prices more sensitive to bad news from elsewhere. Gradual normalization should produce rotation, higher term premia and wider dispersion. A rapid yen rally during a global growth scare could restart the leverage, margin and volatility loop seen in August 2024.
The August TIC release will show whether Japan's Treasury holdings, lower in each month since April, kept falling.
What the numbers can and cannot say
Caveats on timing, scope and coverage sit beside the figures they qualify, and exact values are in the Data Appendix.
Attribution. Same-day moves in global equities and crypto coincided with Federal Reserve policy, oil-price changes and Middle East developments. They are reactions observed after the BOJ decision, and they are not estimates of its causal effect.
Sources. Public post-meeting commentary from market strategists was abundant. Full proprietary reports from Goldman Sachs and J.P. Morgan were not publicly accessible, so we relied on public summaries and official publications. Where a figure rests on a Reuters interview or a third-party summary rather than an official release, the source note beside it says so.
Forward-looking statements. This report contains forward-looking statements based on current assumptions and estimates. Actual outcomes may differ materially. Icarus Asia makes no representation as to the completeness or accuracy of this analysis. This is not investment advice.
Conflicts of interest. Icarus Asia Research has no investment banking relationship with any issuer mentioned in this report. No positions are held in the securities discussed. Readers should independently verify all information before making investment decisions.
Image credit. Cover photograph of the Bank of Japan head office, Tokyo, by Maciej Janiec, licensed under CC BY-NC-SA 2.0. Cropped and darkened for use as a cover background.
© 2026 Icarus Asia. Research published September 21, 2026.
| Prepared by | Icarus Asia Research |
| Data cutoff | Market data through the September 18 close; US Treasury holdings through July 2026; MOF flow data through August 2026 and the week ending September 12 |
| Methodology | Event reading of the September 18 market response; a five-channel transmission framework; comparison with the BIS account of August 2024; IMF and academic work on spillovers; official holdings and flow data |
| Key assumptions | The baseline is a roughly quarterly BOJ path, as forecast by the houses in Table 2. Scenario labels in Table 6 are Icarus Asia's qualitative judgments. The residual in Figure 2 and the funding-cost bounds in section 05 are Icarus Asia's arithmetic, and the dollar conversion of yen borrowing (¥360 trillion, about $2.35 trillion) is Jefferies' own. |
| Limits | We did not have access to proprietary broker research. Dealer and asset-manager views come from Reuters interviews, published summaries and public research pages. Monthly US and Japanese 10-year yields and a Japan–US real-rate series were not available in our sources, so the note contains no differential series or chart, and no source gives the share of the ¥360 trillion of cross-border yen borrowing exposed to a rapid yen rise. |
| Item | Exact figures as reported | Source |
|---|---|---|
| BOJ call-rate target | Around 1.25%, from around 1.0%; effective September 24, 2026 | Bank of Japan |
| USD/JPY, September 18 | High of 158.05 (+1.3%); 156.725–156.76 late in the global session (about +0.5%) | Reuters |
| JGB yields, September 18 | 10-year 2.947% (down about 4.9 bp); two-year 1.835% (down about 2.5 bp) | Pip Theory; EBC |
| Nikkei 225, September 18 | 65,102 (+966, +1.51%); 65,019 (+1.38%); 65,228 (+1.70%), by source and timestamp. TOPIX 4,102.51 (+0.20%) | Trading Economics; Investing.com; a closing-data source |
| Japan's US Treasury holdings ($ billion) | April 1,209.9; May 1,143.1; June 1,116.7; July 1,103.9. July long-term holdings 1,023.754. July change −12.8; April to July −106.0 | US Treasury TIC; FRED |
| Japan's external assets, end-2025 (¥ trillion) | Assets 1,805.634 (+141.360); liabilities 1,243.884 (+117.710); net 561.750 (+23.650). Portfolio 768.653 (equities and fund shares 401.129; debt 367.524, of which long-term 360.515 and short-term 7.009). Direct investment 384.535. Reserve assets 213.672 | Ministry of Finance |
| Nonresident flows, August 2026 (MOF) | Long-term debt −¥684.1 billion; short-term debt −¥4.9658 trillion; equities and fund shares −¥174.0 billion; total −¥5.8239 trillion | Ministry of Finance |
| Nonresident flows, Reuters count | +¥17.9 trillion over six months to August, including +¥3.4 trillion in August | Reuters Breakingviews |
| Nonresident flows, week to September 12 | Long-term debt +¥2.2362 trillion; short-term debt −¥1.2128 trillion; equities and funds −¥1.5228 trillion | Ministry of Finance |
| JSDA, July 2026 | Two- and five-year debt −¥1.28 trillion (net foreign sales); original maturities beyond ten years +¥889.8 billion | JSDA, via Bloomberg |
| Foreign share of JGBs | ¥149.0 trillion, 12.8%, including Treasury bills | Ministry of Finance |
| Nonresident purchases, 2025 | ¥13.3 trillion net of long-dated Japanese bonds, 53% of new purchases | IMF GFSR, April 2026 |
| Cross-border yen borrowing | ¥360 trillion, about $2.35 trillion, by March 2026 | Jefferies, from BIS data (via Reuters) |
| BIS, August 2024 | Carry exposures about ¥40 trillion ($250 billion), likely biased down; yen loans to nonbanks outside Japan about ¥40 trillion; cross-border yen bank claims on offshore nonbanks above ¥80 trillion | BIS Bulletin 90 |