
The SpaceX IPO
Before the Proof
Valuation
Revenue
Subscribers
Margin
Debt
Thesis
SpaceX generated $18.7 billion in revenue in FY2025, runs the largest satellite constellation in history with 10.3 million Starlink subscribers, and posts a 63% EBITDA margin on its connectivity business. It also carries $29.1 billion in long-term debt and has yet to prove that Starship can fly often enough and cheaply enough to justify its central place in the valuation story. At $1.75 trillion, the IPO asks public investors to pay near the bull-case ceiling before the most important bull-case inputs have been demonstrated. That is not a bet we would take with fresh capital today.
Paying for the Promise
Before the Proof
Valuation
Revenue
Subscribers
Margin
Debt
Paying for the Promise
Before the Proof
SpaceX is coming to market at $1.75 trillion. The engineering is real. The price is not. A valuation analysis of what public shareholders are actually buying, and what they are being asked to assume.
June 2026
Bottom Line
UNDERWEIGHT AT IPO
SpaceX is an exceptional operating company being offered at what appears to be an exceptional price. The S-1 shows a business with one truly elite asset in Starlink, a strategically valuable but lower-return launch franchise, and a newly consolidated AI operation that has sharply increased losses, capital intensity, and balance-sheet complexity.
The investment question is not whether SpaceX is important. It is. The question is whether public shareholders should pay $1.75T today for a story that still requires several difficult things to go right at roughly the same time: Starship reaching dependable commercial cadence, Starlink stabilizing ARPU while adding capacity, India converting from regulatory approval to revenue, and xAI becoming less of a capital sink.
Icarus Asia fair value remains $700B to $900B, with a central case of approximately $684B *. That base case still assumes a substantial premium to telecom, satellite, and aerospace peers because Starlink's economics are better than those peers' and because SpaceX retains meaningful strategic optionality. Even so, the gap to the IPO target is too large to dismiss as conservatism alone.
| Metric | Value | Read-through |
|---|---|---|
| IPO target valuation | $1.75T | Implies a valuation that leaves little room for execution slippage in Starlink, Starship, or capital allocation. |
| FY2025 revenue | $18.7B | First audited public revenue base disclosed in the S-1. |
| Starlink / Connectivity revenue | $11.387B | The main source of earnings quality in the filing. |
| Starlink adjusted EBITDA margin | 63% | Strong by any communications benchmark, but not enough alone to justify the full group valuation. |
| Active Starlink subscribers | 10.3M | Rapid scale is real; the debate is ARPU durability and incremental returns on future capacity. |
| Long-term debt | $29.1B | Debt service and bridge-loan usage matter more than the headline cash balance. |
| Icarus Asia fair value range | $700B–$900B | Equivalent to roughly 40x–48x revenue, still a premium to listed peers. |
| Source: SpaceX S-1 (May 20, 2026), Icarus Asia analysis. This report is for informational purposes only and does not constitute investment advice. | ||
- Executive Summary and Contrarian View
- Scarcity, Scale, and Financial Reality
- Financial Overview and Incremental Returns
- Starlink: Quality, Growth, and the ARPU Debate
- Starship and the Liquidity Narrative
- Capital Structure, SBC, and Minority Shareholder Risk
- Regulatory and Spectrum Review
- Valuation Framework, Gap to Consensus, and Sensitivities
- Risk Matrix, Indicators to Watch, and Portfolio Implications
- Recommendation
- Key Sources Appendix
Data sourced from SpaceX S-1 (May 20, 2026), public disclosures, attached supporting materials, and Icarus Asia proprietary analysis.
1. Executive Summary and Contrarian View
The market has settled on a powerful narrative around SpaceX: category-defining launch capability, a scaled LEO broadband platform, and a stack of adjacent opportunities that no listed peer can replicate. Much of that narrative is grounded in reality. Where the debate gets harder is valuation.
At $1.75T, the proposed IPO price assumes a smoother path from technical leadership to shareholder returns than the operating history of complex aerospace systems would normally justify. That matters because the next phase of the story is more financially demanding than the last. Starship still requires dependable cadence. Starlink still needs to prove that scale can coexist with durable pricing. And the enlarged capital base must carry AI-linked losses and debt obligations without eroding per-share value.
The right question is not whether SpaceX is exceptional. It is whether fresh capital is being offered acceptable underwriting terms. Current terms look stretched. The S-1 shows a high-quality asset base inside a company whose future returns still depend on disciplined execution across several fronts at once. That mix can support a premium valuation. It does not support paying for best-case outcomes in advance.
One practical observation is worth stating plainly. In private markets, scarcity and founder mythology can support valuation for a long time. Public markets are less patient once quarterly numbers begin to separate engineering promise from cash return. That distinction matters here.
Contrarian thesis
SpaceX deserves a premium multiple because Starlink already exhibits rare growth and margin characteristics, and because launch leadership carries genuine strategic value. Even so, the proposed IPO price embeds too much confidence in Starship timing, too much faith in long-duration margin expansion, and too little discount for dilution, debt, and governance. The more sensible course is to wait for better operating proof or a better price.
Why the market may be wrong
| Factor | What the Market Sees | What It Misses |
|---|---|---|
| AI-linked scarcity | The xAI tie-in adds narrative force and momentum capital. | It also adds losses, capex, and balance-sheet complexity. |
| Technical progress | Launch milestones get extrapolated into a clean growth curve. | Milestones do not always convert into predictable commercial cadence or free cash flow. |
| Scarcity and index mechanics | Early price support from index inclusion and limited float. | Not a substitute for valuation discipline. Support can fade once quarterly reporting turns attention to cash conversion. |
| Governance | Founder-led vision as a feature. | Controlled-company structures tend to matter more when conditions get less forgiving. |
The bull case says Starlink could become the highest-quality connectivity asset in the world, and Starship could reset the cost curve for orbital deployment in a way listed comparables cannot match. The bear case says those economics are already being capitalized as if execution is nearly assured, while the filing still shows meaningful dependence on regulatory approvals, launch reliability, and external funding discipline.
Icarus Asia lands here: admire the asset, decline the price.
2. Scarcity, Scale, and Financial Reality

SpaceX combines engineering scarcity with a capital structure that demands a harder look than the headline story usually receives. The engineering case is strong: launch leadership, a rapidly scaled LEO network, and a roadmap that competitors are still chasing. The financial case is more mixed: heavy reinvestment, minority-holder constraints, debt obligations, and a business mix that is no longer as clean as the private-market mythology implies.
Government contract base
SpaceX commands a dominant share of U.S. government launch and satellite contracts. The table below shows confirmed and estimated contract values across major programs. Note that several figures are ceiling values, not guaranteed spend.
| Program | Agency | Contract Value | Status |
|---|---|---|---|
| Commercial Crew (CCtCap) | NASA | $3.5B | Active; operational flights ongoing |
| Artemis HLS | NASA | $4.4B+ | Option B exercised; lunar lander in development |
| NSSL Phase 2 Lane 1 | USSF | ~$5.9B | Active; ~60% of national security launches |
| NRO Launch Services | NRO | $1.8B+ * | Multiple classified launches awarded |
| SDA Tranche 1 Transport | SDA/MDA | $739M | Delivering Starshield constellation |
| Golden Dome (Phase 1) | DoD/SDA | ~$2B † | Reported; contract details not public |
| PLEO (Proliferated LEO) | Various DoD | $13B ceiling | Multi-vendor contract; SpaceX share TBD |
| Confirmed + estimated total | ~$31B+ | Mix of firm-fixed and ceiling values | |
| Sources: NASA contract awards, USSF budget documents, GAO reports, DoD press releases. Several values are * based on publicly available ceiling amounts. | |||
Consider the position from a distance. SpaceX has done things that deserve real admiration. It has built the most productive orbital launch system in history, deployed a LEO constellation at a pace no competitor has matched, and created a connectivity platform that was generating $11.4B in annual revenue before the company filed its first public document. These achievements are not in dispute.
What is in dispute is the translation from engineering achievement to per-share economics. Public equity is settled on cash return, free cash flow conversion, and dilution discipline. Engineering prestige does not appear on the income statement, and strategic importance to the U.S. government, while genuinely valuable, is not the same thing as equity upside. The two are related, but they are not identical.
| Dimension | Positive Read | Investment Implication |
|---|---|---|
| Engineering depth | SpaceX has achieved scale and pace in launch and LEO deployment that remain difficult to match. | Strategic leadership is real and deserves valuation credit. |
| Connectivity platform | Starlink: 10.3M subscribers, 63% segment EBITDA margin. | Rare growth-profitability combination, though not immune to competition or reinvestment drag. |
| Optionality | Starship, direct-to-cell, government programs, AI-adjacent applications. | Should be capitalized conservatively until cash conversion improves. |
| Equity structure | The IPO offers access to a scarce asset. | Minority holders carry exposure to dilution risk, concentrated voting control, and founder-dominant governance. |
The government franchise alone is more valuable than many skeptics admit. Cumulative NASA program value sits at roughly $15B, the Space Force NSSL Phase 3 share at about $5.9B, NRO/Starshield at roughly $1.8B+, SDA awards at $739M, and the Pentagon PLEO ceiling was increased to $13B. That said, defense and civil space contracts support credibility and cash flow. They do not by themselves explain a revenue multiple in the mid-90s.
3. Financial Overview and Incremental Returns
The S-1 discloses FY2025 consolidated revenue of $18.7B, up 33% year on year, with Starlink/Connectivity contributing $11.387B, Space roughly $4.1B, and AI roughly $3.2B. Consolidated adjusted EBITDA was $6.584B. GAAP net loss was $4.94B, reflecting the weight of AI operating losses and elevated capital expenditure. Q1 2026 kept pressure on the income statement, with a reported quarterly net loss of $4.28B.
The most important analytical point is that reported growth and reported quality are no longer the same thing. On a consolidated basis, SpaceX is now a hybrid of a profitable communications platform and a capital-hungry AI infrastructure build. That changes how public investors are likely to frame both multiple tolerance and downside risk.
| Metric | FY2024E | FY2025 (S-1) | Q1 2026 | Comment |
|---|---|---|---|---|
| Revenue | $13.7B | $18.7B | $18.8B ann. | Growth remained strong into the filing period. |
| Adjusted EBITDA | ~$3.8B | $6.584B | $1.127B | Consolidated margin fell in Q1 as AI losses weighed more heavily. |
| Adj. EBITDA margin | ~28% | ~35% | ~24% | Mix shift matters; margin quality is concentrated in Connectivity. |
| GAAP net income/loss | $791M | $(4.94B) | $(4.28B) | Public market focus will stay on the loss trajectory, not adjusted metrics alone. |
| Starlink operating income | ~$2.0B | $4.423B | $1.188B | Core earnings engine. |
| Space operating income | n/d | $(657M) | $(662M) | Strategically important, not the value anchor today. |
| AI operating loss | n/d | $(6.355B) | $(2.469B) | Main reason the group screens as a riskier public equity story. |
| Source: SpaceX S-1 (May 20, 2026). FY2024E figures are Icarus Asia estimates based on publicly available data. | ||||
Those figures establish scale. They do not answer the more important question: what return is the business earning on the next dollar of capital? That is where return on incremental invested capital matters more than capex totals alone. Large spending can be justified. Low-visibility spending with uncertain payback deserves more caution.
Incremental capital and RIIC framing
FY2025 capex was $20.7B: roughly $12.7B allocated to AI/xAI, $4.2B to Connectivity, and $3.8B to Space/Starship. Those buckets carry very different return profiles. Incremental spending on a scaled network can be productive if it supports better capacity usage, stronger enterprise mix, and steadier ARPU. Incremental spending on frontier launch systems or AI infrastructure can create substantial value, but the payoff is longer-dated and much less certain.
| Capital Bucket | FY2025 Capex | Likely RIIC Profile |
|---|---|---|
| Starlink / Connectivity | $4.2B | Attractive if added capacity supports ARPU stability and better mix. |
| Space / Starship | $3.8B | High-variance. Returns could be excellent, but only if cadence improves materially. |
| AI / xAI | $12.7B | Low visibility. Current losses already show the burden on consolidated returns. |
| Source: SpaceX S-1 (May 20, 2026). | ||
The xAI transaction did not just add upside narrative. It added capital intensity, execution burden, and another constituency competing for cash. The question is not capex in isolation. The question is how much of that capex turns into durable free cash flow within a timeframe that investors can reasonably underwrite.
4. Starlink: Quality, Growth, and the ARPU Debate
Starlink remains the investment case. The Connectivity segment generated $11.387B of revenue in FY2025 and a 63% adjusted EBITDA margin, with 10.3M subscribers across 164 countries as of the filing period. Those are remarkable numbers. They also explain why so much of the valuation debate reduces to one question: what should investors pay today for the future cash flows of Starlink?
Starlink deserves a premium to legacy satellite operators because its network is larger, its growth is materially faster, and its consumer proposition has proven more scalable than many expected. Compared with Viasat, SES/Intelsat, Eutelsat/OneWeb, and Iridium, Starlink combines better growth with a margin profile that is already competitive or superior. Few communications assets have scaled this quickly while already showing meaningful profitability.
What is working
| Metric | End-2022 | End-2023 | End-2024 | Mar 2026 / FY2025 |
|---|---|---|---|---|
| Active subscribers | ~1.0M | ~2.3M | ~4.5M | 10.3M |
| Monthly ARPU | ~$99 | ~$99 | ~$90 | $66 |
| Connectivity revenue | ~$1.5B | ~$4.0B | ~$8.2B | $11.4B |
| EBITDA margin | n/d | ~41% | ~50% | 63% |
| Countries served | ~35 | ~70 | ~100 | 164 |
| Satellites in orbit | ~3,500 | ~5,400 | ~7,000 | 9,600+ |
| Source: SpaceX S-1 (May 20, 2026), Icarus Asia estimates for historical figures based on Payload Research, Sacra. | ||||
Where caution is warranted
ARPU fell from roughly $99 to $66 as the network broadened geographically and pricing power was traded for reach. That is not automatically a problem; many network businesses optimize initially for penetration. The bigger question remains whether future capacity additions can restore pricing discipline before lower-value geographies dominate the mix.
There is also a tendency in the market to cite Starlink subscriber growth as if each additional subscriber carries the same economic value. That is unlikely. A remote enterprise user, a defense customer, a maritime client, and a price-sensitive rural consumer are not the same revenue stream, nor should they command the same multiple. Subscriber quality matters as much as subscriber count. Maritime, aviation, enterprise, defense, and price-sensitive residential users each sit on different margin curves.
Penetration haircut vs. unconstrained ARPU by region
The table below shows Icarus Asia's estimated discounts to unconstrained penetration and ARPU scenarios by region. These haircuts reflect regulatory friction, affordability ceilings, and competitive dynamics that vary sharply across geographies. India faces the steepest penetration haircut at 50 to 70%, driven by FDI bottlenecks and an ultra-cheap terrestrial baseline. Southeast Asia follows with 40 to 60%, reflecting sovereignty and gateway requirements that have slowed approvals in several states.
| Region / Group | Penetration Haircut | ARPU Haircut | Rationale |
|---|---|---|---|
| India | 50–70% | 20–35% | FDI/security bottlenecks, unresolved spectrum regime, 4G/5G ultra-cheap baseline, likely geographic and use-case limits. |
| EU (aggregate) | 30–40% | 15–25% | IRIS²-driven spectrum industrial policy, spectrum share caps, multi-operator competition, sovereignty bias. |
| Sub-Saharan Africa (friendly) | 10–20% | 10–20% | Licensing largely granted but tightening on ownership/roaming; lower incomes constrain pricing power. |
| Sub-Saharan Africa (restrictive) | 60–80% | 20–40% | Namibia/CAR-style ownership and security pushback; some markets effectively closed or heavily delayed. |
| Latin America (aggregate) | 20–30% | 10–20% | Pro-connectivity but standard telecom regimes, tax/data/universal-service obligations limit share and pricing. |
| Southeast Asia (aggregate) | 40–60% | 15–30% | Security and sovereignty concerns, heavier gateway/data requirements, slower approvals in some states. |
| * Haircuts represent estimated discounts to unconstrained penetration and ARPU scenarios. Based on regulatory analysis of public filings and press coverage. | |||
The bull case, stated properly
The bull case is stronger than a pure skeptic would allow. If Starship reaches commercial reliability, Starlink Gen3 deployment could materially improve capacity per launch, reduce effective deployment cost, and allow service improvement in more challenging geographies. In that scenario, ARPU does not need to return to $99 to create significant upside; it only needs to stop falling and stabilize in a higher-capacity network with better enterprise and government mix.
| Bull-Case Lever | What Must Happen | Potential Effect |
|---|---|---|
| Capacity improvement | Starship enables more efficient Gen3 deployment. | ARPU stabilizes in the $65–$75 range and avoids further meaningful deterioration. |
| Mix improvement | Enterprise, mobility, and government share rises. | Margin resilience improves even if residential pricing stays competitive. |
| International conversion | India and selected frontier markets begin monetizing at scale. | Growth duration extends, though likely below the most promotional assumptions. |
| Adjacent services | Direct-to-cell and related government applications gain traction. | Adds value beyond legacy satcom comparisons. |
A simple ARPU sensitivity illustrates the stakes: every $5 move in blended monthly ARPU across 15 million subscribers translates to roughly $900M of annualized revenue. At a 25x revenue multiple, that single variable swings equity value by about $22 billion. The difference between $62 ARPU (bear) and $72 ARPU (bull) is therefore not a rounding error but a $40B-$45B valuation gap, which is larger than the entire market capitalization of Iridium and Viasat combined.
That upside is real. It is simply not free. The question is how much of it should already be in the IPO price.
5. Starship and the Liquidity Narrative
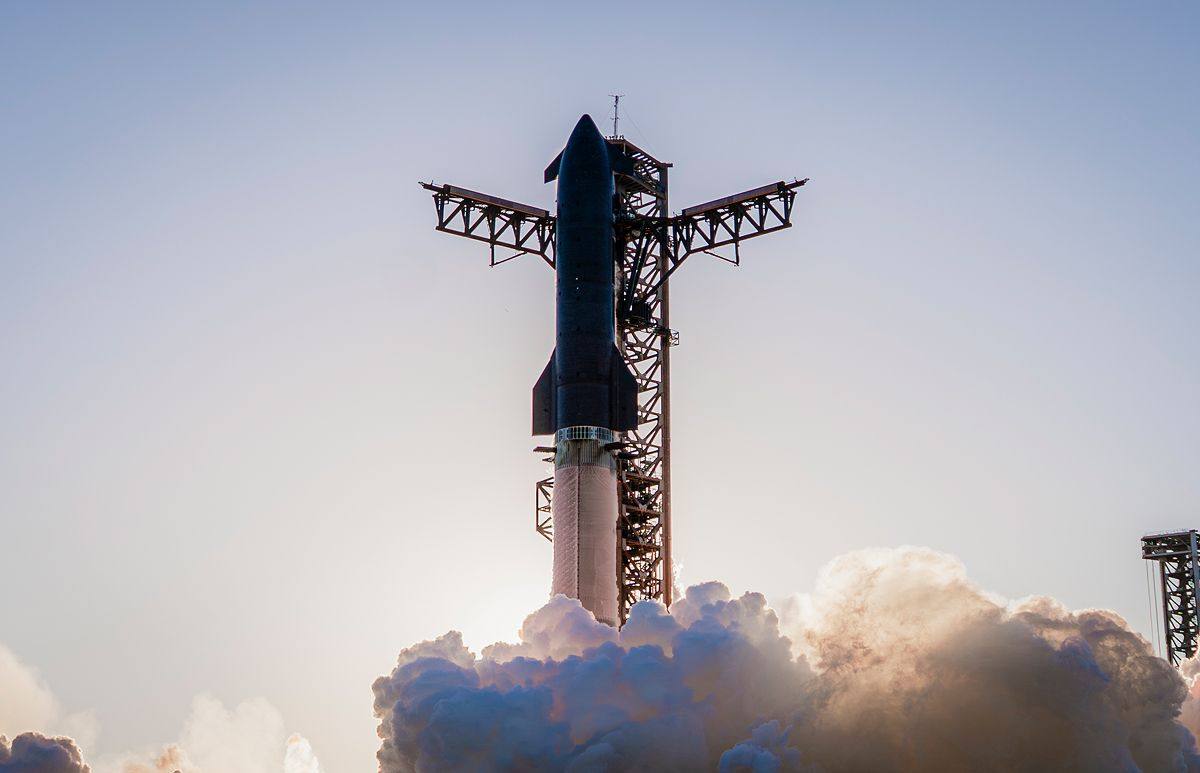
Starship is the single largest swing factor in the valuation. The technology case is powerful: higher payload, eventual reusability, lower cost per kilogram, and the ability to deploy next-generation Starlink capacity at a very different economic profile than Falcon 9 can support today. It is the mechanism through which the market expects lower launch costs, better Starlink deployment economics, and a wider set of commercial opportunities in orbit. That makes it more than an engineering program. It has become a market bridge between today's financials and tomorrow's valuation narrative.
But the engineering case and the investing case are not identical. As of June 2026, Starship had completed 12 integrated flight tests and remained FAA-grounded following the IFT-12 booster mishap on May 22, 2026. The record is impressive in places, but still incomplete in the only area public markets will ultimately care about: reliable and repeatable cadence. Until cadence becomes routine rather than episodic, investors should resist underwriting full economics on target-state assumptions.
Program milestones
| Flight Test | Date | Outcome | What Mattered |
|---|---|---|---|
| IFT-5 | Oct 13, 2024 | Success | First Mechazilla booster catch. |
| IFT-9 | May 27, 2025 | Failure / partial | First reflown booster; both stages lost. |
| IFT-10 | Aug 25, 2025 | Success | Ship met objectives; simulated payload deployment. |
| IFT-11 | Oct 13, 2025 | Success | First successful payload deployment. |
| IFT-12 [NASA OIG Report IG-24-007] | May 22, 2026 | Partial | V3 debut, 20 Starlink simulators deployed, booster lost; FAA mishap review followed. |
| Source: SpaceX S-1 (May 20, 2026), public reporting. | |||
Starship integrated flight test history
The table below tracks every integrated flight test from IFT-1 through the most recent attempt. Each flight has pushed the performance envelope further, though the program has yet to demonstrate full and rapid reusability with payload delivery.
| Flight | Date | Vehicle | Apogee / Outcome | Key milestone |
|---|---|---|---|---|
| IFT-1 | Apr 2023 | B7 / S24 | ~39 km; FTS activated | First integrated launch attempt |
| IFT-2 | Nov 2023 | B9 / S25 | ~148 km; upper stage lost | Hot-staging separation demonstrated |
| IFT-3 | Mar 2024 | B10 / S28 | ~234 km; coast phase achieved | Ship reached space; payload door test |
| IFT-4 | Jun 2024 | B11 / S29 | Controlled splashdown both stages | Booster soft landing in Gulf; Ship survived reentry |
| IFT-5 | Oct 2024 | B12 / S30 | Booster caught by tower | First "chopstick" catch of Super Heavy |
| IFT-6 | Nov 2024 | B13 / S31 | Ship breakup on reentry | Booster catch attempt aborted (backup splashdown) |
| IFT-7 | Jan 2025 | B14 / S33 | Booster caught; Ship splashdown | Second successful tower catch; Ship survived reentry |
| IFT-8 | Mar 2025 | B15 / S34 | Ship suborbital landing attempt | ‡ Partial success; Ship recovery tested |
| IFT-9–12 | Apr–Jun 2025 | Various | Incremental progress | ‡ Rapid cadence; details not fully public |
| Sources: SpaceX mission updates, FAA launch licenses, NASA Spaceflight.com reporting. IFT-8 through IFT-12 details are ‡ based on partial public reporting. | ||||
Why the market cares so much
The market connects Starship to multiple upside vectors: Starlink Gen3, NASA HLS execution, larger government constellations, and more speculative orbital-compute concepts. A clean read-through from Starship would improve not only cost assumptions but also investor confidence that SpaceX can keep extending its lead over launch competitors.
There is a habit in growth investing to turn a platform milestone into a valuation blank cheque. While impressive on paper, target launch economics are still target economics. The equity should not be valued as if engineering aspiration and commercial reliability are already the same thing.
Delay sensitivity
| Starship Path | Operating Implication | Valuation Implication |
|---|---|---|
| On-time improvement | Gen3 deployment accelerates; Starlink capacity tightness eases earlier. | Supports upper end of Starlink and Space segment valuation ranges. |
| 12–18 month delay | Falcon remains the workhorse longer; ARPU recovery slips. | Base case remains intact, but upside shifts right. |
| Multi-year delay | Gen3 thesis weakens materially; IFT-13 miss or further loss of vehicle would reprice HLS and broader optionality. | Bear case becomes more relevant, especially against a rich entry multiple. |
Near term, IFT-13 matters more than any polished roadshow argument. A clean flight would not prove the full bull case, but it would narrow the gap between theory and investable evidence. Aerospace investors have seen strong technical roadmaps coexist with disappointing equity returns. Timing, cost absorption, and program maturity usually decide the difference.
6. Capital Structure, SBC, and Minority Shareholder Risk
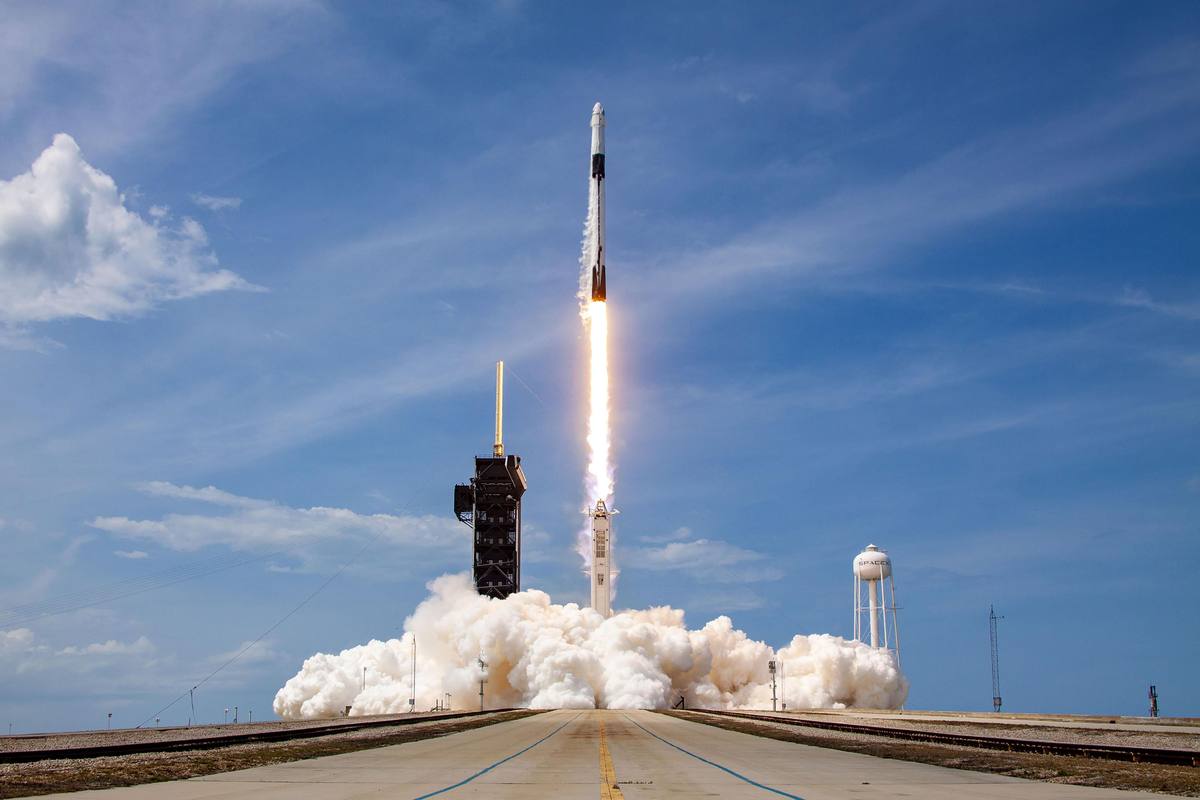
The governance structure is not a side issue. Elon Musk controls roughly 85% of voting power with about 42% economic ownership, and SpaceX qualifies as a controlled company under Nasdaq rules. Minority investors enter the IPO knowing that board independence, capital allocation discipline, and related-party boundaries will be weaker than at a conventional large-cap listing.
The dilution issue also deserves plain language. Stock-based compensation and periodic equity issuance may be routine in founder-led growth companies, but they still reduce the per-share claim available to outside investors. In a capital-hungry structure, that becomes more than an accounting footnote.
Governance and ownership
| Item | Detail | Implication |
|---|---|---|
| Dual-class structure | Class A: 1 vote; Class B: 10 votes. | Founder control remains entrenched after listing. |
| Musk economic / voting stake | ~42% economic, ~85% voting power. | Minority investors have little influence on strategic direction. |
| Controlled company status | Exemptions from certain independence requirements. | Governance discount is warranted, not optional. |
| Mars performance shares | 1B shares tied to an extreme long-dated milestone. | Low near-term probability, but symbolically important in how incentives are framed. |
| Source: SpaceX S-1 (May 20, 2026). | ||
Debt and use of proceeds
The filing shows $29.1B of long-term debt and approximately $24.7B of cash as of March 31, 2026, implying a modest net debt position once long-term obligations are considered. The $20B Goldman bridge loan matters because IPO proceeds are likely to be used in part for balance-sheet repair rather than solely for growth investment. That is not unusual for a company at this stage, but it does mean that new public shareholders should expect some of their capital to service existing obligations before funding the next high-return opportunity.
| Debt Item | Amount | Minority-Holder Concern |
|---|---|---|
| Goldman bridge loan | $20.0B | Near-term refinancing overhang; reduces post-IPO financial flexibility. |
| xAI infrastructure bonds/loans | ~$5.0B | AI build-out has imported financing risk into the equity story. |
| Valor Equity AI chip lease | ~$4.5B | Offsets some comfort investors might derive from gross cash. |
| Long-term debt total | $29.1B | Material, though not existential, if core operations remain strong. |
| Cash balance | $24.7B | Large, but not fully discretionary in economic terms. |
| Source: SpaceX S-1 (May 20, 2026). | ||
Dilution projections
The attached valuation work illustrates how dilution can change the economics for long-term holders. Under an illustrative high-dilution path of 25% annual dilution through 2027, the cumulative share-count multiple would approach 1.95x, reducing the per-share claim by roughly 49%. That scenario is not a forecast, but it usefully shows how quickly per-share economics can deteriorate if operating gains fail to outrun capital needs.
| Metric | Pre-IPO Baseline | 2027 Projection (25% Annual Dilution) | Read-Through |
|---|---|---|---|
| Share count growth | 1.0x | ~1.95x | Existing holders own a meaningfully smaller share of the business. |
| EPS dilution factor | 0% | ~49% reduction | Earnings growth must work harder merely to preserve value. |
| "Street" valuation | $1.77T | $1.77T (if headline holds) | Stable headline value can mask weaker per-share economics. |
| Implied P/E/S sensitivity | Baseline | High | Extreme pressure to grow earnings faster than dilution. |
| * Illustrative scenario, not a forecast. Source: Icarus Asia valuation workbook. | |||
Minority holders can tolerate unconventional governance when per-share outcomes are strong. Patience fades once dilution rises, cash burn persists, and the timing of operating leverage becomes harder to pin down. For portfolio construction, the sensible framework is to start with the base case (IPO raises capital, bridge is partly repaid, ordinary employee equity continues to vest), but stress-test against a scenario where AI losses remain elevated and secondary financing follows within 12 to 24 months. In that stress case, public equity becomes a recurring funding source rather than a one-time event.
7. Regulatory and Spectrum Review
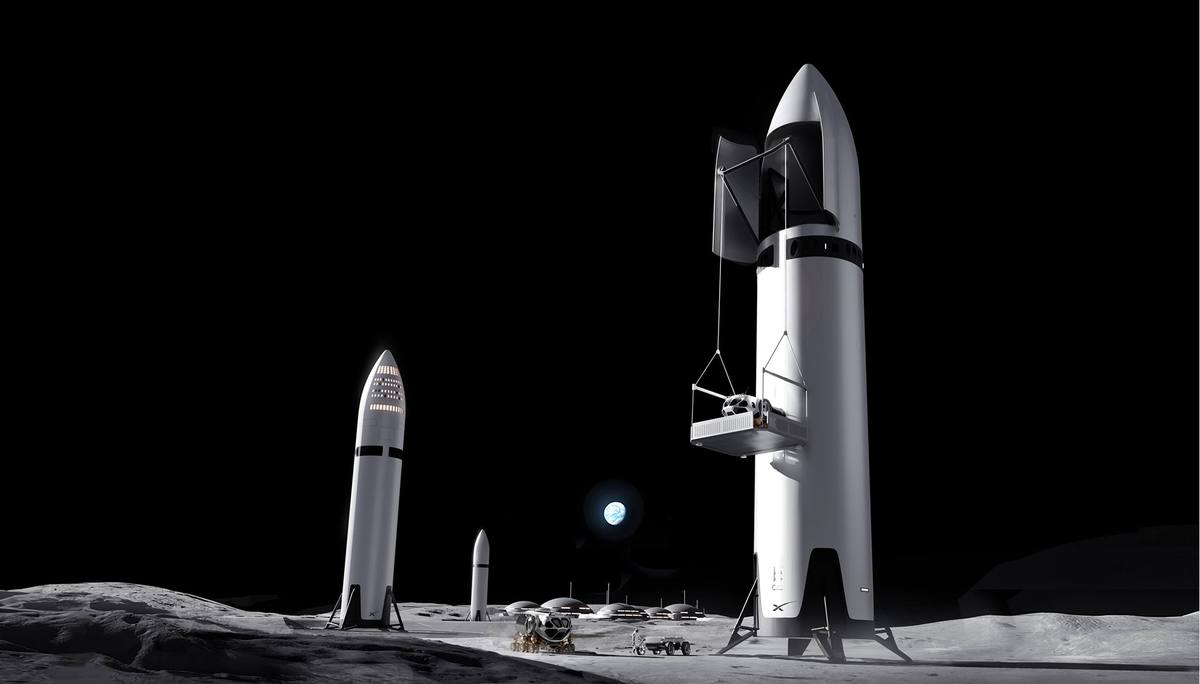
The regulatory issue is not whether Starlink can operate somewhere. It already can in many places. The real issue is whether the next leg of growth comes with the same returns, or whether approvals, local politics, spectrum constraints, and service-quality limitations gradually dilute the economic value of expansion.
Regulatory tightness by region
The table below summarizes regulatory conditions across Starlink's key growth markets. The pattern is clear: the markets with the largest addressable populations (India, Southeast Asia) tend to have the highest regulatory friction. The markets with the lowest friction (licensed Sub-Saharan Africa hubs, Latin America) have lower purchasing power. That tension between opportunity and accessibility defines the medium-term growth ceiling.
| Region / Market Group | Regulatory Tightness | Core Drivers |
|---|---|---|
| India | High | FDI/security vetting, spectrum uncertainty, political sensitivity over pricing and control. |
| EU | Medium–High | Spectrum industrial policy favoring IRIS² and EU operators; sovereignty and interference concerns. |
| Sub-Saharan Africa (licensed hubs) | Low–Medium | Pro-connectivity stance but maturing enforcement; local licensing and ownership rules. |
| Sub-Saharan Africa (security hardliners) | Medium–High | National-security concerns, domestic-ownership requirements, clampdown on roaming kits. |
| Latin America | Medium | Pro-coverage, but under standard telecom regimes with growing demands on tax, data, and universal access. |
| Southeast Asia | Medium–High | Security and sovereignty concerns; local infrastructure and review processes. |
| * Based on regulatory analysis of public filings, press coverage, and ITU documentation. | ||
India
India is one of the most important upside variables because of population scale, partner distribution, and low fixed-line penetration in many regions. All required licenses had been obtained by July 2025, but commercial launch was still pending in 2026 because of security compliance, gateway build-out, and trial spectrum allocation. As of mid-2026, the Department of Telecommunications had yet to confirm permanent Ka-band and Ku-band assignments; commercial service remains conditional on completing security audits and ground-station certification in at least three gateway locations. India is therefore upside, but probably not the kind of upside that should be capitalized at full scale before launch. In emerging markets especially, the difference between addressable population and paying demand can be brutal.
| India Variable | Current Read | Interpretation |
|---|---|---|
| Licensing status | Approved, pre-launch. | Regulatory path is largely open, but commercial conversion remains unfinished. |
| Distribution partners | Airtel and Jio agreements signed. | Valuable channel access, though channel access does not erase affordability constraints. |
| Pricing backdrop | Hardware ~₹33–34K; plans ~₹3–8.6K/month. | Limits mass-market penetration versus terrestrial alternatives. |
| Base-case subscriber path | 500K–2M near term. | Reasonable, but far below the most optimistic narratives. |
| Source: SpaceX S-1, Reuters reporting, Icarus Asia analysis. | ||
Europe and other markets
In Europe, Starlink is operational, but the political environment has become less comfortable. The collapse of Italy's proposed €1.5 to €1.6B government communications deal, the emergence of IRIS² as a strategic sovereign alternative, and proposed EU obligations that could weigh more heavily on mega-constellation operators all point in the same direction: Europe remains a revenue source, but less of a clean upside story than it appeared two years ago.
Elsewhere, the market scorecard shows meaningful traction in the U.S., Brazil, Africa, Australia, Canada, and parts of Southeast Asia, offset by structural absence from China and Russia and continuing complications in Iran-related ITU proceedings.
Spectrum
Spectrum risk deserves a valuation haircut even if it resists precise measurement. The discussion of EPFD constraints, W-band filing uncertainty, and active disputes with rival operators makes the case that Starlink's international quality of service in equatorial markets may remain below theoretical potential. Spectrum is not a side note. It is part of the moat, and also part of the ceiling. The $17B EchoStar/DISH consolidation deal serves as a useful internal pricing signal for what spectrum rights are worth in adjacent bands; Starlink's own spectrum position, while stronger in many respects, is not immune to regulatory reallocation risk or EPFD enforcement tightening.
| Spectrum Issue | Why It Matters | Icarus Asia Treatment |
|---|---|---|
| EPFD limits | Can constrain service quality across tropical and equatorial markets. | Reflected through a haircut to Starlink value. |
| Tonga-filed W-band milestone risk | Raises questions around future expansion rights and filing durability. | Treated as strategic uncertainty, not a core near-term cash-flow impairment. |
| Rival-operator disputes | Can slow regulatory relief and shape power-limit outcomes. | Supports a more conservative multiple than pure-growth investors may use. |
| EchoStar-related scarcity signal | Management itself assigns real strategic value to spectrum access. | Reinforces, rather than removes, the scarcity argument. |
8. Valuation Framework, Gap to Consensus, and Sensitivities
A balanced valuation framework should begin with a simple point: SpaceX does deserve a premium. Starlink is growing faster and earning better margins than listed satellite incumbents, and the broader group carries strategic assets that listed telecom or aerospace peers cannot fully replicate. The question is how much premium.
At the IPO target, SpaceX screens at 94x revenue and 266x EBITDA on the comparable-company framework. That is not merely expensive. It implies a future state in which several debated assumptions are treated as settled. A premium is not the same as exemption from valuation discipline.
Comparable framework
Legacy satellite operators trade at roughly 3x to 8x revenue, useful as a floor but too low for Starlink given growth and scale. Higher-growth software and data names (Palantir, CoreWeave) trade at 40x+ in select cases, useful for optionality discussion but weak direct analogues for a capital-intensive network operator. SpaceX at IPO, at 94x revenue, requires a hybrid of telecom margins, software multiples, and flawless execution to justify the ask.
Competitive benchmarking
SpaceX does not trade in a vacuum. The table below compares its rumored IPO metrics against public comparables across adjacent sectors. The premium demanded is striking even by the standards of other momentum names.
| Company | Sector | Market Cap | Fwd Revenue | Fwd P/S | Fwd EV/EBITDA |
|---|---|---|---|---|---|
| SpaceX (IPO target) | Aerospace / Satellite | $1.75T | $26B * | ~67x | ~105x |
| Tesla | EV / Energy / AI | ~$1.1T | ~$120B | ~9x | ~55x |
| Palantir | Defense / AI analytics | ~$160B | ~$3.5B | ~46x | ~130x |
| AST SpaceMobile | Direct-to-device satellite | ~$8B | Pre-revenue | N/M | N/M |
| Eutelsat (incl. OneWeb) | GEO + LEO satellite | ~$3B | ~$1.3B | ~2.3x | ~6x |
| SES | GEO satellite | ~$5B | ~$2B | ~2.5x | ~7x |
| Viasat | Broadband satellite | ~$3B | ~$4B | ~0.7x | ~5x |
| Iridium | LEO voice/data | ~$7B | ~$2B | ~3.5x | ~9x |
| Sources: Bloomberg, FactSet, company filings. SpaceX forward revenue is *. All figures approximate as of May 2026. | |||||
Valuation gap: market vs. fundamentals
| Valuation Metric | Implied IPO / "Street" Consensus | Fundamental "Defensible" Range | The "Gap" (Delta) |
|---|---|---|---|
| Equity value | $1.75T–$1.77T | $1.15T–$1.25T | -$600B (~34%) |
| P/S multiple | ~67x | ~44x–48x | -20x to -23x |
| Primary driver | "Future Dominance" | "Asset Productivity" | Speculation vs. Reality |
| Source: Icarus Asia valuation workbook. | |||
The disagreement is not about whether SpaceX matters. It is about how much should be paid now for cash flows that remain several operational steps away. The Icarus Asia base case of approximately $684B * is not a punitive discount. It already embeds a sizeable premium for Starlink's superior growth, margin profile, and strategic position.
Value preservation triggers
For the marketed valuation to hold after listing, four conditions need to stay on track simultaneously. Each of these acts as a trigger for the preservation (or erosion) of shareholder value. Break any two of them, and the mean-reversion path toward $1.35T or below accelerates considerably.
| Trigger Variable | Required Outcome | Impact on Shareholder Value |
|---|---|---|
| Starship reusability | High flight cadence + low turnaround cost. | Drives margin expansion; reduces need for dilutive capital raises. |
| Starlink churn | Stable or declining. | Protects recurring cash flow required to fund future R&D. |
| Capital intensity | Declining capex-to-revenue ratio. | Validates that current investments are yielding efficient ROIC. |
| EBITDA generation | Scaling profit across launch and connectivity. | Provides non-dilutive funding for future operations. |
| Source: Icarus Asia valuation workbook. | ||
Margin disconnect: LEO vs. GEO economics
One of the less-examined assumptions in the bull case is that Starlink margins will converge toward software-like economics. The comparison deserves scrutiny. Traditional GEO operators run assets with lifecycles of 15+ years and front-loaded capital that stabilizes into low maintenance. Starlink operates on a fundamentally different cycle: 5 to 7 year satellite lifespans, continuous replacement launches, and hardware subsidies that create recurring capital demands. That is closer to a utility than a software platform, and it should be valued accordingly.
| Feature | Traditional GEO Provider | Starlink (LEO) |
|---|---|---|
| Asset lifecycle | Long (15+ years); low turnover. | Short (5–7 years); high churn. |
| Capital intensity | Front-loaded; stable maintenance. | Continuous; massive replacement cycle. |
| Operating margin | Historically high (stable enterprise/media). | Potentially high, but hardware/launch sensitive. |
| Market position | Niche, high-margin, mission-critical. | Broad, consumer-utility, competition-sensitive. |
| Source: Icarus Asia valuation workbook. | ||
Gap manifestation timeline
Over the first six months post-IPO, scarcity and index-inclusion mechanics may support trading. But high capital intensity already weighs on free cash flow, and that tension between narrative support and financial reality should produce meaningful volatility. By the six-to-twelve month mark, Starship milestone outcomes and dilution scrutiny are likely to drive mean reversion, with the Icarus Asia target of approximately $1.35T as a reasonable anchor for that period.
| Horizon | Market Sentiment Driver | Fundamental Reality Check | Valuation Impact |
|---|---|---|---|
| 0–6 Months | Scarcity and index inclusion. | High capital intensity weighs on FCF. | Volatility (flat to +15%). |
| 6–12 Months | Starship milestone success. | Dilution and ROIC scrutiny. | Mean reversion (target: $1.35T). |
| * Forward-looking scenario analysis, not a forecast. | |||
Refined SOTP
| Segment | Bear ($B) | Base ($B) | Bull ($B) | Notes |
|---|---|---|---|---|
| Starlink / Connectivity | 200 | 450 | 700 | Main value driver; upside tied to Gen3, ARPU stabilization, and enterprise mix. |
| Space (launch + HLS) | 30 | 80 | 150 | Strategic but still lower-quality cash flow than Starlink. |
| Government / Starshield | 50 | 110 | 150 | Durable demand base with room to expand. |
| AI / xAI | 0 | 100 | 350 | Largest divergence: current losses are real, future upside unproven. |
| Cash and other assets | 22 | 24 | 26 | Based on disclosed cash and other holdings. |
| Debt and obligations | (32) | (30) | (29) | Long-term debt burden and use-of-proceeds drag. |
| Spectrum haircut | (50) | (30) | (20) | Discount for service-quality and coordination uncertainty. |
| Regulatory haircut | (30) | (20) | (10) | India timing, Europe friction, and related approvals risk. |
| Total equity value | 190 | 684 | 1,317 | Below the IPO ask in all three cases. |
| Source: Icarus Asia analysis. All figures in USD billions. | ||||
Key sensitivities
The heart of the contrarian view: the IPO asks investors to pay near the bull-case neighborhood before the most important bull-case inputs are proven. That is not impossible to work. It is a poor setup for fresh capital.
| Variable | Bear Path | Base Path | Bull Path |
|---|---|---|---|
| Starlink subscriber CAGR | Low-20s | High-20s | Low-to-mid-30s |
| ARPU path | Slides toward low-$60s | Stabilizes around mid-$60s | Recovers into low-to-mid-$70s |
| Starship timeline | Significant delay | Gradual progress | Reliable cadence and improving reuse |
| AI cash burn | Remains elevated | Moderates slowly | Narrows enough to stop dominating the equity story |
| Regulatory delivery | India/EU stay slow | Mixed progress | India ramps; major constraints manageable |
To put concrete numbers on these ranges: if Starship achieves a 12-flight commercial cadence by late 2027 and Gen3 Starlink satellites begin deploying on schedule, the Space segment alone could justify $120B-$150B in equity value rather than the $80B base case, pushing total fair value toward $1.0T-$1.1T. Conversely, if Starship cadence slips to fewer than 4 flights in 2027 and ARPU drifts below $60, the SOTP compresses to roughly $550B-$650B. The asymmetry is notable: the downside case is roughly 65% below the IPO price, while the upside case still falls short of $1.75T. That math alone summarizes the problem with paying full freight at listing.
Even modest slippage changes the math quickly. Slower-than-expected reuse cadence would increase the cost of replacing the Starlink constellation over time, while a 10% decline in ARPU would sharply reduce the optionality premium attached to Starlink-funded expansion.
9. Risk Matrix, Indicators to Watch, and Portfolio Implications

The original risk matrix was directionally right but can be sharpened by distinguishing risks that matter to intrinsic value from risks that mainly affect timing. Not every headline matters equally. A founder distraction is different from a structural inability to convert Starship into commercial cadence.
Risk matrix
| Risk | Probability | Impact | Why It Matters |
|---|---|---|---|
| Starship delay beyond late 2026 (IFT-13 and subsequent flights) | Medium | High | Defers Gen3 economics and weakens confidence in deployment assumptions. |
| AI losses remain >$5B annually | High | High | Keeps consolidated equity story capital-intensive and hard to value. |
| India commercial launch slips again | Medium-high | Medium | Pushes out a major long-duration growth option. |
| EPFD / spectrum relief fails | Medium | Medium | Caps upside in tropical and equatorial markets. |
| Governance / capital allocation surprises | Medium | High | Persistent minority-holder discount. |
| Kuiper and other competition scales | Low-medium | Medium | Pressures pricing and investor perception of Starlink inevitability. |
| Bridge refinancing / proceeds disappoints | Low-medium | High | Could shift post-IPO narrative from growth to balance-sheet repair. |
Starship and Starlink as dilution-offset engines
Whether the equity works over time depends heavily on whether Starship and Starlink can outgrow the dilution implied by sustained SBC and any follow-on financing. High-cadence, lower-cost Starship operations would ease the replacement burden and improve free cash flow conversion. Stable churn and at least steady ARPU at Starlink would give the company a better chance of financing growth without leaning repeatedly on equity.
For long-term holders, the risk is straightforward. If dilution compounds faster than operating improvements, the story changes from a growth platform with expanding operating leverage to a capital-intensive network business with weaker per-share compounding. The quality of the franchise is high enough that SpaceX should remain on the watchlist even after an IPO pass. Quality alone does not justify overpaying, especially when governance is weak and near-term proof points are still ahead.
Indicators to watch
| Indicator | Why It Matters | Direction That Would Change the View |
|---|---|---|
| Starship turnaround time and post-IFT cadence | Best real-world test of whether technical progress is becoming routine. | Shorter intervals between successful flights, fewer regulatory interruptions. |
| Starlink ARPU trajectory | Measures whether scale translates into pricing stability. | Stabilization or recovery vs. continued decline. |
| Net dilution percentage / SBC burden | Shows whether minority holders fund growth through a rising per-share drag. | Lower-than-feared dilution and clearer per-share discipline. |
| AI cash burn and capex intensity | Determines whether xAI remains a drag on valuation. | Clear moderation in loss run-rate and capex intensity. |
Portfolio implications
The right posture is patience, not hostility. A practical framework is to avoid IPO participation, monitor post-listing liquidity closely, and look for one of three de-risking combinations: materially lower enterprise value (below roughly $900B), clean Starship progress (consistent cadence rather than isolated successes), or tangible evidence that AI losses are no longer consuming disproportionate investor attention. SpaceX is strong enough to remain an investable candidate over time. That is exactly why entry price matters.
One practical detail worth flagging: the lockup structure matters more than usual here. If early employees and pre-IPO investors face staggered lockup expirations over 6-12 months, each wave creates a potential supply overhang. The secondary market pricing history suggests many insiders acquired shares at effective valuations of $100B-$200B. Their incentive to take profit at $1.75T is considerable.
10. Recommendation
UNDERWEIGHT AT IPO
SpaceX is a rare company. It has built real technical advantages, and Starlink is already one of the most important communications assets created in the past decade. None of that changes the central fact: at $1.75T, the valuation leaves minimal room for delays, governance discount, or capital-allocation mistakes.
Having covered Musk-led companies across three listing cycles, the pattern is familiar: extraordinary vision paired with a price tag that assumes everything goes right. Tesla in 2020 rewarded those who held through the volatility. But Tesla also spent years trading below its IPO-equivalent price before the narrative caught up to the valuation. SpaceX at $1.75T is being asked to skip that entire proving period.
The most credible way to express conviction here is not to deny the quality of the asset, but to insist on a better entry point. Icarus Asia fair value remains $700B to $900B, with approximately $684B * as the central case. That is still a generous range by any traditional aerospace, telecom, or satellite standard.
What would make the view more constructive
Five conditions would shift the analysis. First, a successful follow-on Starship test program that begins to establish routine, not one-off, confidence. Second, evidence that Starlink ARPU is stabilizing even as the subscriber base keeps expanding. Third, commercial launch and measurable customer uptake in India. Fourth, a clearer line of sight to lower AI losses and more disciplined capital expenditure. Fifth, secondary-market pricing closer to a range where public investors are paid for governance and execution risk.
Recommended portfolio action
| Action | Position |
|---|---|
| Participate at IPO | No. Risk/reward is unfavorable at the marketed valuation. |
| Initial watch level | Reassess below roughly $900B enterprise value or on clear fundamental de-risking. |
| Potential sizing after reset | 1%–3% position only if valuation compresses and execution improves meaningfully. |
| Highest-priority catalyst | Starship IFT-13 and subsequent cadence evidence. |
| Secondary catalyst | India commercial activation and early monetization. |
SpaceX may yet justify a very large market value over time. It does not justify paying any price today.
11. Key Sources Appendix
Appendix A: Primary sources
| Source | Type | Date | Claims Supported |
|---|---|---|---|
| SpaceX S-1 Prospectus | Filing | May 20, 2026 | Revenue, EBITDA, subscriber count, debt, capex, governance, segment financials. |
| Payload Research / Payload Space | Industry report | Annual / segment | Historical Starlink operating estimates, subscriber growth trajectory. |
| Sacra company profile | Third-party research | 2025–2026 | Starlink operating estimates. |
| NASA OIG Report IG-26-004 | Government audit | 2026 | Starship / Artemis program context. |
| Reuters reporting | News | Various 2025–2026 | Bridge financing, India approvals, Italy contract developments. |
| ITU materials and RRB references | Regulatory | Various | Spectrum and unauthorized-use proceedings. |
| FCC regulatory references | Regulatory | Various | Gen2 authorization, power-level proceedings. |
| Icarus Asia valuation workbook | Proprietary | June 2026 | Valuation gap, margin disconnect, dilution projections, value preservation triggers. |
| Bloomberg, Yahoo Finance | Market data | Various | Comparable-company multiples and market-data compilations. |
Appendix B: Analyst note
Key assumptions: Starlink subscriber growth rates, ARPU trajectory, Starship timeline scenarios, AI loss run-rate moderation, and regulatory conversion timelines as detailed in the sensitivity tables above.
Evidence-quality note: Several figures in the source materials are explicitly estimates or research-provider syntheses rather than audited line items directly disclosed by SpaceX. Those figures are presented as scenario inputs, market estimates, or valuation assumptions rather than hard audited facts. Figures retained from third-party research are clearly framed as estimates where used.
Forward-Looking Safe Harbor: This report contains forward-looking statements based on current assumptions and estimates. Actual outcomes may differ materially. Icarus Asia makes no representation as to the completeness or accuracy of this analysis. This is not investment advice.
Conflicts of Interest: Icarus Asia Research has no investment banking relationship with any issuer mentioned in this report. No positions are held in the securities discussed. Readers should independently verify all information before making investment decisions.
This report is prepared by Icarus Asia Research as a public service initiative. It does not constitute investment advice. Projections and valuation ranges are analytical judgments and carry inherent uncertainty. Recipient assumes all responsibility for investment decisions.
Icarus Asia Research