
News · Macro · India
India's Missing Trillions Aren't Really Missing
India's statistical overhaul cut ₹43.9 lakh crore, about $464 billion, from the country's measured economy. None of it was lost production. Why it vanished is also why this quarter's 7.8 percent growth rate cannot be checked from the outside.
Subhash Chandra Garg asked the right question in the wrong way, and for 10 days nobody gave him an answer.
The question came on television in early September, after India's statistics ministry reported that the economy had grown 7.8 percent in the April-to-June quarter. Garg, who was India's finance secretary for five months in 2019 and has spent the years since picking holes in the official data, pointed out that the ministry had quietly marked down its estimate of the same quarter a year earlier by about six trillion rupees, or $63.4 billion. Strip that revision out, he said, and growth was 2.6 percent. Three days later he put it at about 5 percent.
A change in methodology, he told CNBC’s Indian affiliate, does not explain "what went out of the production to bring down the value of last year's GDP by six trillion rupees."
Yet the math he relied on to call India's economic growth into question does not hold up when checked against the data. The question itself turns out to have an answer, and the answer is more interesting than the fight it got lost in. Nothing went out of production. Output in the rebuilt national accounts is higher, not lower. What went up faster was the cost of the inputs consumed to produce it.
That finding, which comes from a Mumbai economist working through the revised statistics line by line, shines a new light on the entire dispute. It also explains why the one number everybody has been shouting about is the one number nobody outside the ministry can check.
What Can Be Checked
Start with what is not in dispute, because it sets the terms of the argument.
Gross domestic product is not handed down from a model. It is value added by sector, summed, plus net taxes on products. India's Ministry of Statistics and Programme Implementation publishes every component, which means the headline can be rebuilt from its parts by anyone with the press note and a spreadsheet.
And it adds up.
At constant prices, sectoral value added of 68.19 lakh crore rupees, or about $720.7 billion, a year ago and 73.82 lakh crore, or $780.3 billion, this year, plus net taxes of 7.25 and 7.54 lakh crore ($76.6 billion and $79.7 billion), gives 75.44 lakh crore against 81.36 lakh crore, or $797.4 billion against $860 billion. That is growth of 7.85 percent against a published 7.8 percent. Run the same sum at current prices and you get 10.33 percent against a published 10.3 percent. The gap is a rounding error.
Nobody is inventing totals, though.
The published figure is consistent with its published components, and the economy-wide price adjustment implied by those components, 2.31 percent, matches the 2.3 percent the statistics secretary gave reporters on Sept. 2.
The trouble was never in the addition but in the choice of price index to subtract, and that's where the doubt sets in.
A Calculation That Shrank the Economy
India changed three things at once in February, and did so under pressure.
The International Monetary Fund's 2025 country report had graded India's national accounts a C, its second-lowest rank, and outlined the reasons. An outdated base year, reliance on the wholesale price index, and the use of single deflation, a shortcut that assumes the prices a factory pays and the prices it charges move together.
The February overhaul changed all three.
It moved the base year to 2022-23, introduced a producer price index, and adopted double deflation for manufacturing, which prices inputs and outputs separately. Then it produced a number that made the government's critics sit up, and the reforms that produced it were the ones the IMF had actually asked for.
The recalculation also shrank the economy.
Moving the base cut the measured level of Indian output for 2022-23 by 7.7 lakh crore rupees, or $81.4 billion, about 3 percent. Across four revised years the cumulative cut amounts to 43.9 lakh crore, or $464 billion; the opposition Congress party has been campaigning on the rounder 43 lakh crore, about $455 billion. A 2022 IMF working paper found that among 78 economies which rebased in recent years, the median one revised its GDP up by 3.5 percent.
India went the other way, and not by a little. And seniority has not been able to settle what to make of that.
Kaushik Basu, now at Cornell, chief economic adviser in New Delhi before that and chief economist at the World Bank after, called Garg's analysis "the best analysis I have heard." Another former chief economic adviser, Booth school alum, and IMF policy wonk, Prof. Krishnamurthy V Subramanian called it "a hilarious demonstration of economic ignorance."
Both men have held the same job.
V Anantha Nageswaran, who holds it now, called Garg's comparison cherry-picking, and on the narrow point, the former UBS and Credit Suisse economist is right. Two series measured with different rulers do not subtract. The revised base was published in February, months before the print that set off the row.
Where It Went Awry
Anil K Sood teaches at the Institute of Advanced Studies in Complex Choices in Mumbai.
In the first week of September he told CNBC's Indian affiliate that the new series showed "the estimated size of the Indian economy was smaller than what was projected under the old series." Then he went and worked out why.
His answer, published on Sept. 10, is one sentence long and it has been almost entirely ignored.
"The proximate accounting source of the lower GVA estimate," Sood wrote, "is not a downward revision of output, but a much larger upward revision of the intermediate goods and services used in producing that output."
"The proximate accounting source of the lower GVA estimate" - Anil K. Sood, Institute of Advanced Studies in Complex Choices
Output went up.
Intermediate consumption went up more, by more than 2 percent in both revised years, concentrated in construction, trade and repairs, hotels, real estate and professional services, with manufacturing revised substantially as well. Two other things moved with it. Capital consumption rose across utilities, mining and public administration. Compensation of employees fell by roughly 7.2 lakh crore, or $76.1 billion, across two years.
The picture Sood draws is of an economy in which "more of gross output is absorbed by intermediate inputs, more of gross value added is absorbed by capital consumption, and less net income is recorded as compensation or operating surplus." The revised India, he writes, is "even more capital-intensive and less net-income-generating than the old economy."
He is careful not to call any of it an error, and he is right to be.
A statistical system that can suddenly see contractor chains and intermediate transactions it previously missed would produce exactly this signature. So would procurement inefficiency. So would related-party billing, or genuine fragmentation of production into longer supply chains. Those are very different countries with identical accounting fingerprints, and telling them apart needs data nobody has published yet.
Why a Bigger Input Bill Makes Growth Shakier
Here is where the two halves of the story fuse.
Value added is output minus intermediate consumption. Raise intermediate consumption materially and value added becomes a smaller difference between two larger numbers. The 2008 System of National Accounts manual, the international rulebook, warns about precisely this. Because value added is that small difference, it is, in the manual's words, "extremely sensitive to error."
India did two things in the same stroke.
It revised the input block upward, making value added a thinner residual. And it adopted double deflation for manufacturing, a method whose whole premise is deflating output and inputs separately and taking the difference.
The level cut and the deflator argument turn out to be one revision seen from opposite ends.
Three Prices No One Can Verify
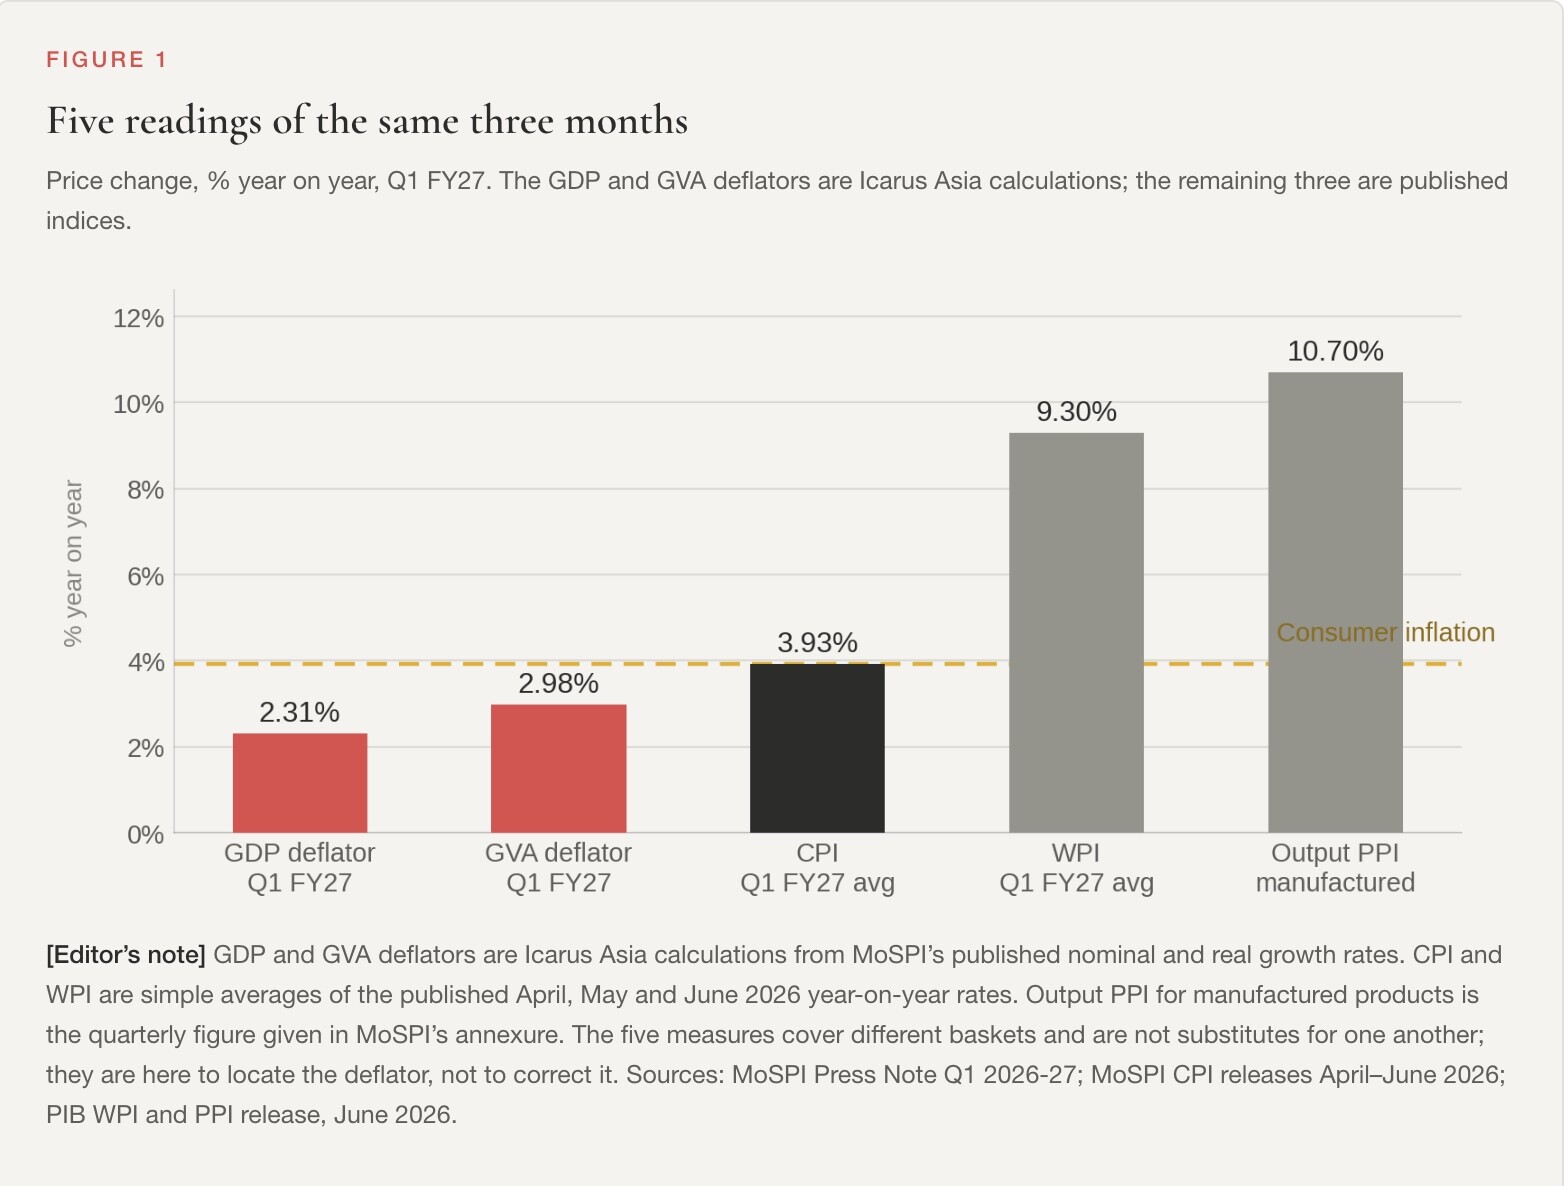
India's implied economy-wide price rise for the quarter was 2.31 percent. Consumer inflation over the same three months averaged 3.93 percent. Wholesale inflation averaged 9.30 percent.
The gap between those last two is the whole issue.
Wholesale prices running more than five percentage points above consumer prices means input-heavy sectors faced cost inflation their output prices never matched, which squeezes measured value-added prices wherever inputs and outputs are deflated apart, and lifts measured real growth in those sectors.
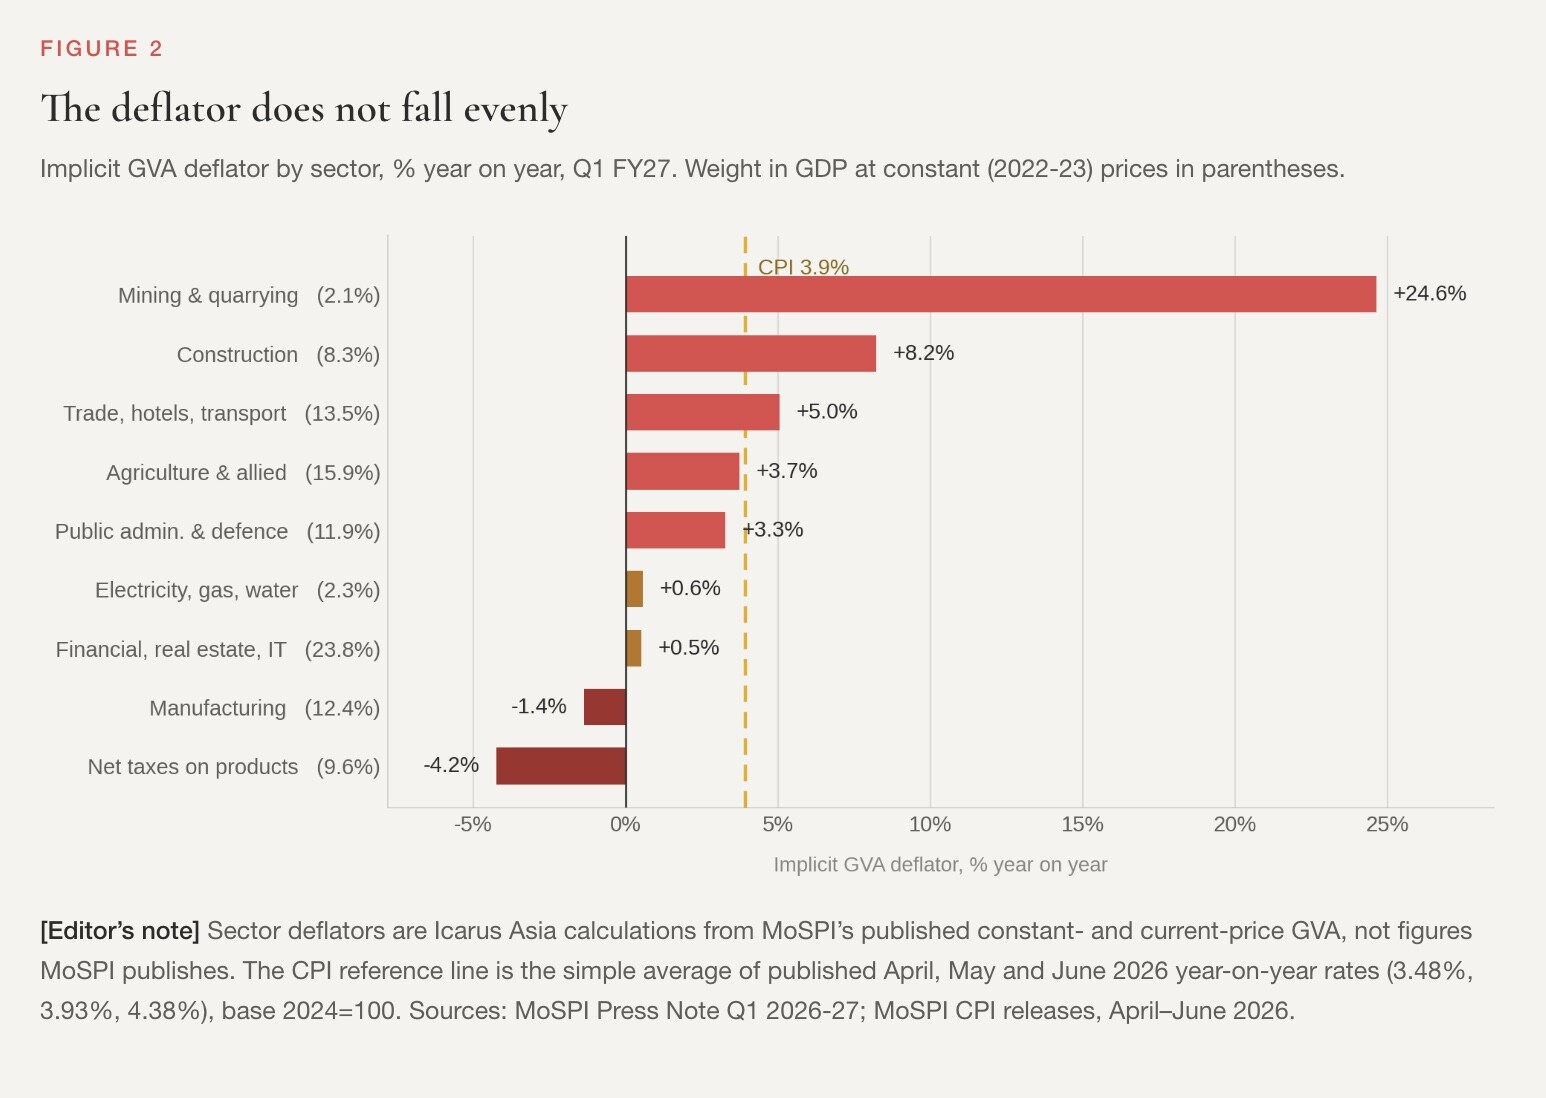
Break the 2.31 percent into its nine components and six behave unremarkably. Three do not.
Manufacturing shows prices falling 1.36 percent while real output grows 9.17 percent. Pronab Sen, India's first chief statistician, has said this can happen under double deflation and cannot happen under single deflation, and the ministry's press note now says the same in its own words.
The quarter supplied the conditions. Fuel and power wholesale inflation ran at 27.41 percent in June, crude petroleum and natural gas output prices at 58 percent. Against that, the Index of Industrial Production, which counts units rather than rupees and needs no price adjustment at all, put manufacturing volumes up 6.50 percent across the quarter. The two measures answer different questions and can legitimately diverge. They diverge most, as it happens, exactly when input prices outrun output prices.
Meanwhile, net indirect taxes carry the largest negative price adjustment in the accounts, minus 4.24 percent, on a component worth 9.6 percent of GDP.
This one is not a puzzle.
India's goods and services tax rationalization took effect on Sept. 22, 2025, shifting somewhere between 12 and 15 percent of goods into lower brackets. The comparative quarter sat entirely under the old rates. National accounts apply base-year tax rates to current volumes, so a rate cut registers as falling prices by construction.
It also runs against the critics. Because taxes drag on GDP but not on value added, the cut makes real GDP growth look lower than real GVA growth, not higher.
Because taxes drag on GDP but not on value added, the cut makes real GDP growth look lower than real GVA growth, not higher.
The block that should worry people has attracted the least attention. Financial services, real estate, ownership of dwellings, IT and professional services.
It is the largest block in the economy at 23.8 percent, it contributed 2.89 of the 7.85 percentage points, and its implied price rise is half of one percent. Parts of that defend themselves. Imputed rent on owner-occupied housing tracks rent, which ran at 2.10 percent. Software and professional services earn in dollars. But there is no volume index for legal advice or bank intermediation. Nothing exists against which to test it.
What's in a Discrepancy
There is one more crack, and it is in a place the argument has not reached.
National accounts can be built two ways, from production or from spending, and the two should land in the same place. India's did not.
On the expenditure side, investment grew 11.9 percent in real terms against 7.1 percent for household consumption, and the components together grew 11.2 percent against a published headline of 7.8 percent.
The difference is what the ministry calls "discrepancies."
It was positive 1.37 lakh crore rupees, or $14.4 billion, a year ago and negative 1.06 lakh crore, or $11.2 billion, this quarter, a swing of 2.43 lakh crore, about $25.7 billion, between consecutive quarters, or roughly 3.2 percent of the base. A residual of some size is normal in every country's accounts. This one moved in the direction that pulls a faster-growing spending measure down toward the production headline.
Reconciling the two sides is the job of the supply-use table, which India stopped compiling years ago and has now restored.
Sen has called that absence one of the country's worst statistical losses. "Not only should they not have stopped," he said, "but they should have actually expanded it."
It is back.
So far the ministry has applied it only to the estimates measured in current prices. The constant-price side, the side where every one of these deflator questions lives, remains unreconciled, because doing it needs item-level input and output prices that still do not exist for many sectors.
So What Was the Number?
Hold the ministry's volumes and nominal figures exactly where they are and vary only the treatment of the two prices that cannot be independently checked.
Substituting industrial-production volumes for manufacturing costs about a third of a percentage point. Lifting the services price adjustment to 2 percent, between imputed rent and the published figure, costs a little under four tenths more.
That produces a band of roughly 6.4 to 7.9 percent, centered near 7.1 percent.
The band is a measure of how much the unverifiable assumptions matter, not a rival estimate of Indian output, and it carries the weakness of both substitutions it rests on. Analysts polled by Reuters before the release had expected 7.1 percent. That is a coincidence, and it should be read as one, since the poll was forecasting the published series rather than second-guessing it.
What the official tables will not produce, under any coherent method, is 2.6 percent. Or for that matter 5 percent.
Standard Chartered's Anubhuti Sahay, who credited the improvement to better methodology rather than to the base revision, put the honest version plainly.
"It is not that the GDP number is only froth," she said. The percentage is arguable. The direction, however, is not.
"It is not that the GDP number is only froth" - Anubhuti Sahay, Standard Chartered
A C Grade Is Still Not a Clean Bill
Raghuram Rajan, the former governor of the Reserve Bank of India, was widely reported to have questioned the quarter. He then wrote on LinkedIn that he had done nothing of the kind, that he had neither questioned nor endorsed the numbers, and that his concern was a longer-running puzzle. Why strong growth has never shown up in jobs, in domestic investment, or in foreign portfolio flows.
The distinction was lost almost immediately.
The Indian journalist Rajdeep Sardesai asked Gita Gopinath, the IMF's former chief economist, about India's methods at Davos this year. Her answer was less comforting.
"When I was chief economist of the IMF, we used to ask ourselves this question all the time," she said, "and the truth is, for pretty much most emerging and developing countries of the world they would get close to a C-grade on their national account statistics." She added that the Fund had seen no "smoking gun evidence that there was something particularly bad about India's GDP numbers versus any other countries."
Both halves of that are true and neither is an endorsement.
The gaps she describes, in price indices and in deflation technique, are the gaps this quarter's argument has been about. They are ordinary. And ordinary is never the same as fine.
Reema Bhattacharya of Verisk Maplecroft, a risk intelligence and data analytics firm, isolates the residual problem where most Indian statisticians would.
The accounts lean heavily on formal-sector corporate filings while statisticians have to estimate a very large informal economy. The distance between the two is where public skepticism has always existed.
What Is Still Shut
Three things can now be checked that could not be a month ago.
The ministry has published producer price indices by broad category. It has published a trial index for input prices. And its press note explains, for the first time, the mechanism by which a manufacturing price adjustment can turn negative.
Still unpublished are the granular input prices the calculation actually consumes. So is an answer to a plain contradiction.
The statistics secretary told reporters the new series runs on more than 300 deflators for inputs and outputs, up from around 180, while the input index published in June is labeled a trial and researchers tracking the series say it will be some time before input prices feed the national accounts at all. Both statements cannot describe the same thing.
The ministry's own documentation, the volume titled Sources and Methods, was promised by September.
Sen, who has been asking for it longest, never wanted the new index thrown out. He wanted the two series run side by side, long enough for outsiders to see where they part company and why.
"What you're saying, in effect, is, 'Trust me,'" he said. "But trust is only built when you can compare."
The author is an Executive Director and Head of Research and Analysis at Icarus Asia an independent financial research and market analysis firm that specializes in macroeconomic insights, structural fixed-income analysis, and liquidity trends across Asian and global capital markets.
DISCLAIMER: This is strictly not investment advice. You are requested to consult with a registered financial advisor before taking any, or all, decisions.
Sources
Batra, Shubham. "Explainer: Why India's Strong GDP Growth Is Raising Eyebrows." Reuters, Sept. 3–4, 2026. reuters.com
Business Standard. "Tax Turbulence: Revenues Take a Hit in First Full Month of GST 2.0." Dec. 1, 2025. business-standard.com
Business Today. "At Davos 2026, Gita Gopinath Was Asked About India's GDP Data Methodology. Her Response." Sept. 3, 2026. businesstoday.in
Business Today. "The GDP Conundrum: Economists Split Over India's Faster Than Expected 7.8% GDP Growth Rate." Sept. 2, 2026. businesstoday.in
Data for India. "How India Measures GDP." dataforindia.com
Icarus Asia Research. India's Q1 FY27 GDP — Reconstructed. Sept. 12, 2026.
Ministry of Statistics and Programme Implementation. Press Note on GDP Estimates for Q1 2026-27. Aug. 31, 2026. mospi.gov.in
Mishra, Asit Ranjan. "Methodology of New GDP Series Is Questionable, Says Pronab Sen." Business Standard, Sept. 4, 2026
Press Information Bureau. "Press Release of Consumer Price Index on Base 2024=100 for June 2026." pib.gov.in
Press Information Bureau. "India's Index of Industrial Production Records Growth of 7.3% in June 2026." pib.gov.in
Press Information Bureau. "Provisional Estimates of Wholesale Price Index, Output Producer Price Index, and Trial Input Producer Price Index for the Month of June 2026." pib.gov.in
Republic World. "India IIP Growth Hits 4.9% in April 2026 as MoSPI Revises Base Year to 2022-23." June 1, 2026. republicworld.com
Salve, Priyanka. "India's June Quarter GDP Print Is Courting Controversy. Here's Why." CNBC, Sept. 4, 2026. cnbc.com
Sood, Anil K. "7.8% GDP Growth, 3% Smaller Economy: Does PM Modi's Herculean Feat Add Up?" The South First, Sept. 3, 2026. thesouthfirst.com
Sood, Anil K. "Data Dive: GDP Revision and What It Reveals About How India Produces." The South First, Sept. 10, 2026. thesouthfirst.com
X-Rates. "Monthly Average USD/INR, 2026." x-rates.com
Notes
Growth rates are year on year.
Constant-price figures use the 2022-23 base introduced in February 2026 and are not comparable with the 2011-12 series.
One lakh crore is one trillion rupees.
Dollar conversions use 94.61 rupees to the dollar, the average rate for April to June 2026, and are approximate; figures quoted from other outlets may reflect different rates.
Data cuts off for official statistical releases at July 31, 2026, press and commentary to Sept. 10, 2026.