
News · Markets · US
With U.S. Stocks at Rare Valuation Peaks, The Margin for Error Just Vanished
Bank of America and Citigroup say their bear-market checklists have hit levels not seen since the dot-com era and the 2008 financial crisis. The S&P 500 closed near a record on Monday.
Two of Wall Street's largest banks issued their sharpest warnings in years last week, telling clients the stock market is showing the kind of stress fractures that have preceded every major crash of the past quarter-century. The S&P 500 closed at 7,405.73 on Monday, near its all-time high.
The disconnect has become the defining feature of mid-2026: the higher the market climbs, the louder the alarms get, and the less anyone seems to care.
Bank of America strategists led by Savita Subramanian said on June 5 that 70 percent of the firm's proprietary bear-market warning indicators have been triggered. "Too many red flags," Subramanian wrote, recommending investors "take profits." The S&P 500, she noted, is statistically overvalued on 17 of 20 metrics her team tracks. On eight of those measures, the index is trading at richer levels than during the peak of the 2000 technology bubble.
One day later, Citigroup's Bear Market Checklist hit 11.5 of 18 U.S. risk flags, its highest reading since the 2008 financial crisis. Globally, Citi flagged 10 of 18 indicators, also a post-2008 record.
The two reports, arriving 24 hours apart from rival banks, amount to an unusual convergence. Wall Street firms rarely say "sell." That two of them are now saying versions of "be careful" at the same time, using different methodologies that reach the same conclusion, is worth paying attention to.
The Method Behind the Madness
The raw valuation data supports the anxiety.
The Shiller CAPE ratio, which divides the S&P 500's price by a decade of inflation-adjusted earnings to smooth business-cycle noise, stands at approximately 41.6 as of June 8. That is the second-highest reading in the metric's 155-year history. The only time it was higher was January 2000, when it hit 43.8. The S&P 500 lost 49 percent over the following two and a half years.
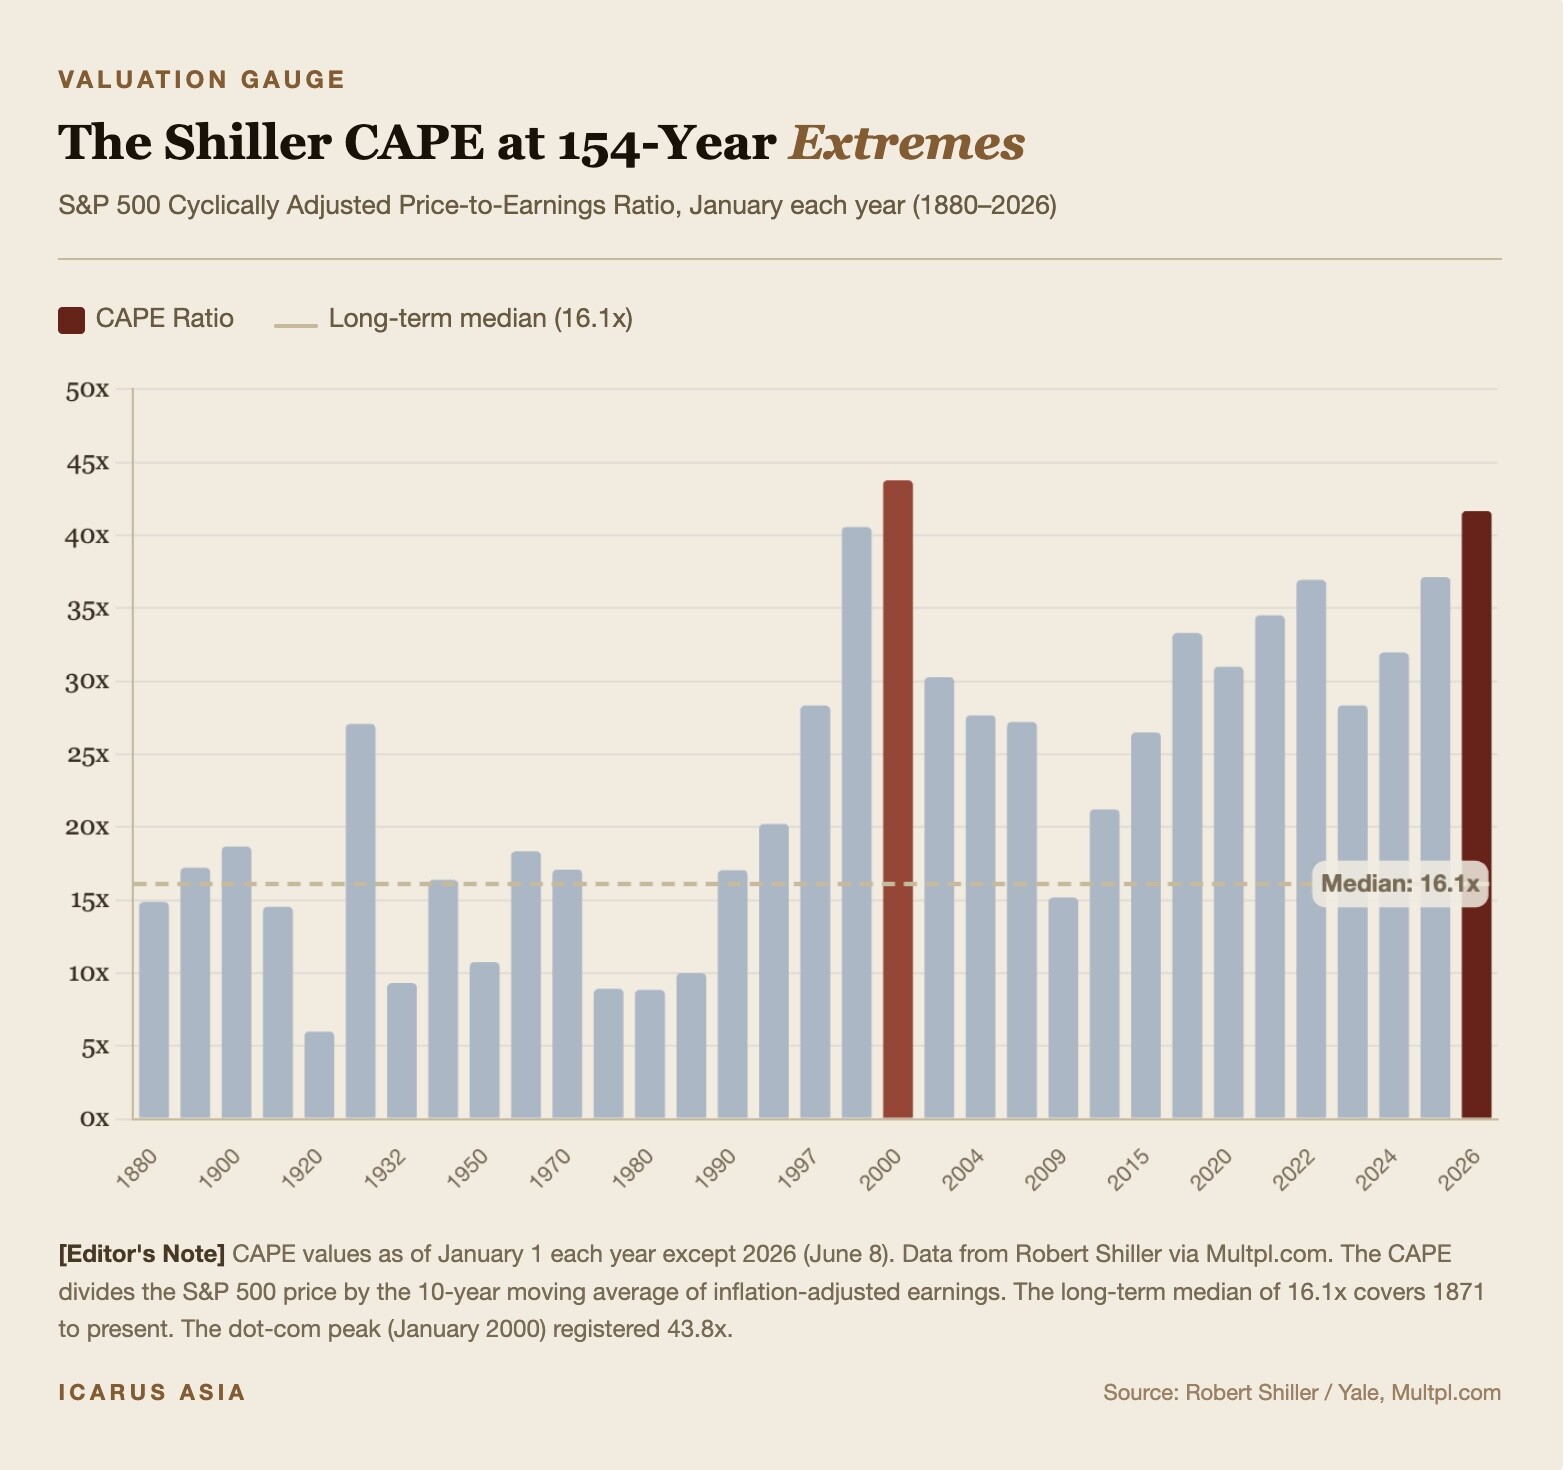
The long-term median CAPE since 1871 is 16.1. The current reading is 158 percent above that line.
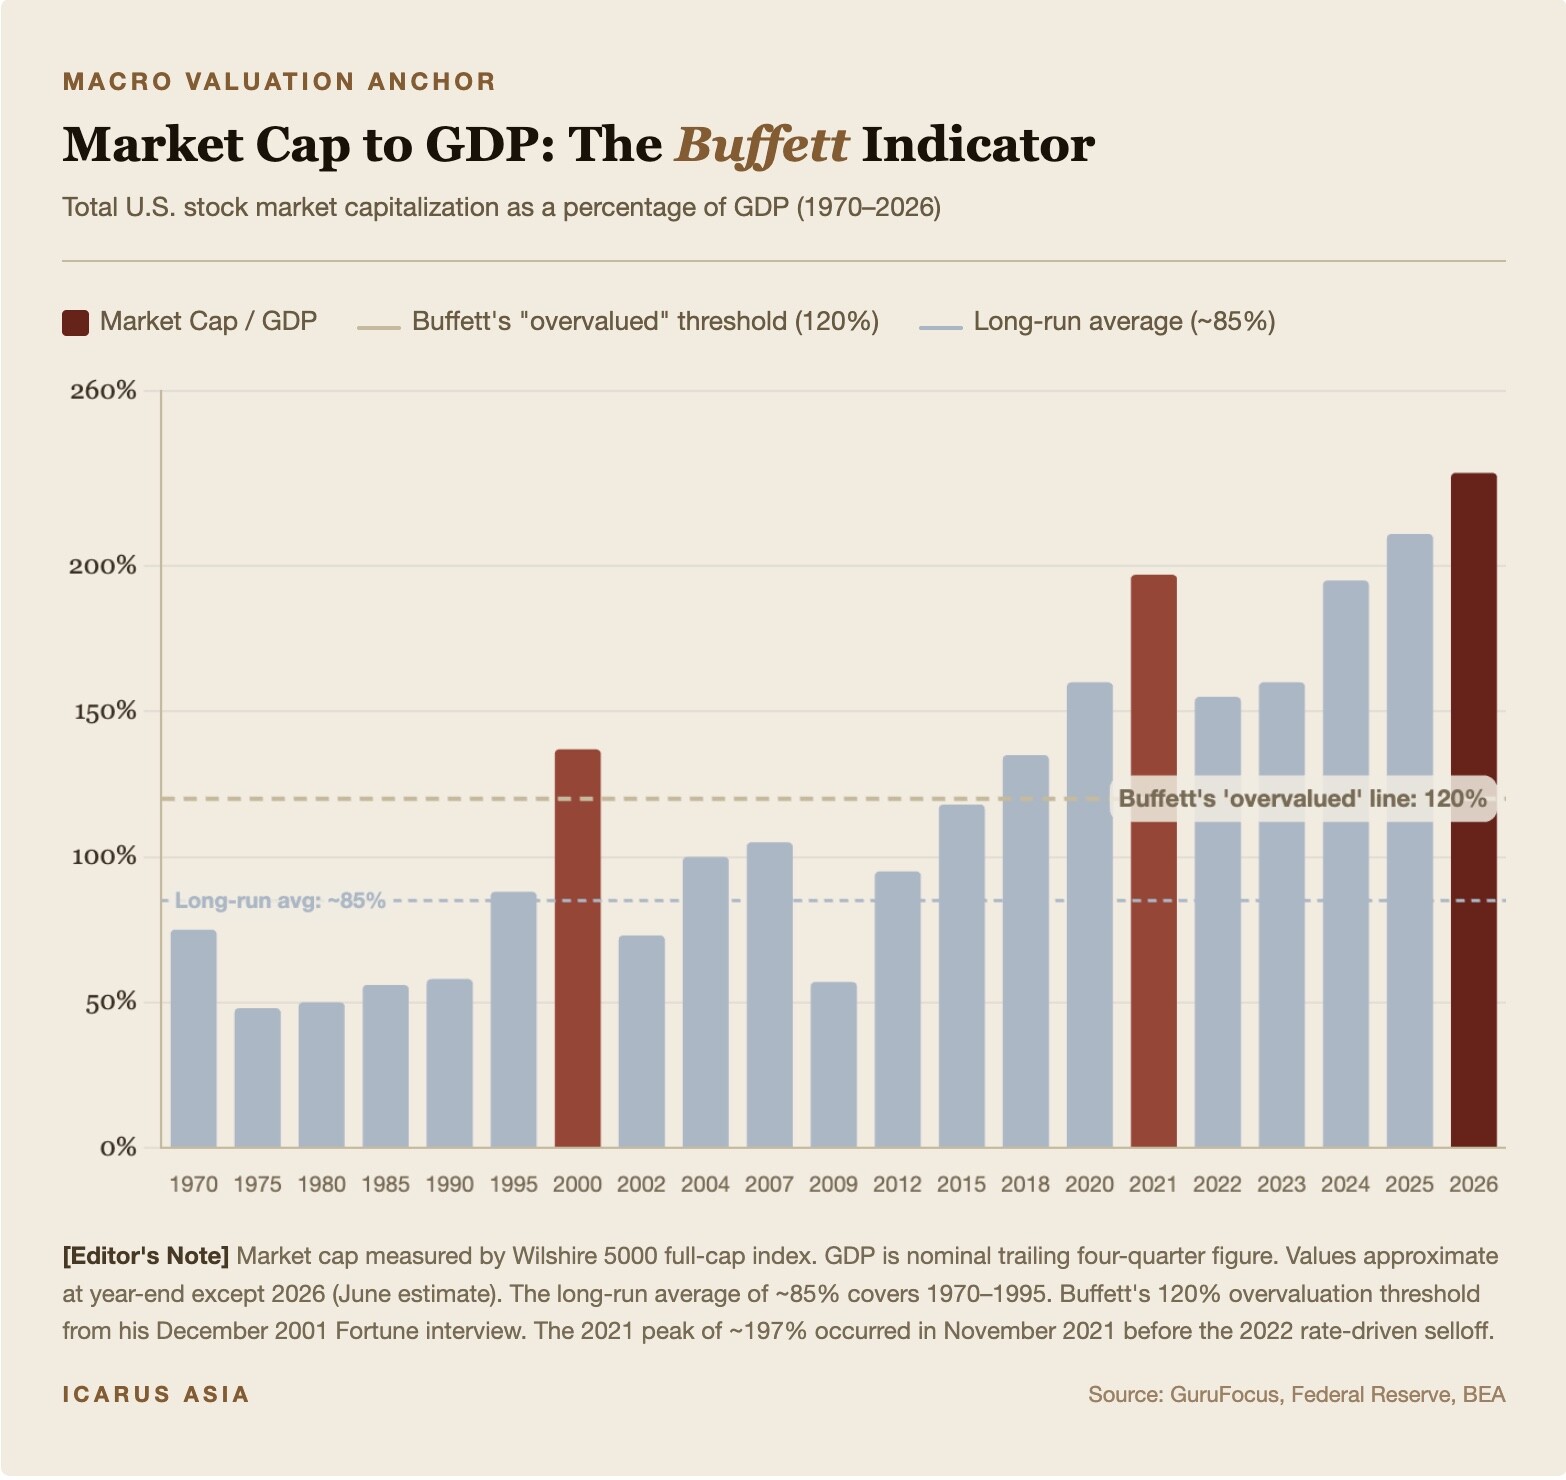
The Buffett Indicator, which divides total stock market capitalization by GDP, is at roughly 230 to 239 percent depending on the source. Warren Buffett said in a 2001 Fortune interview that anything above 120 percent signals overvaluation. The market is nearly double his red line. The dot-com peak, for comparison, reached only 137 percent.
The equity risk premium, the extra return investors receive for owning stocks instead of Treasury bonds, has compressed to roughly zero. The S&P 500's forward earnings yield is about 4.6 percent. The 10-year Treasury pays about 4.3 percent. The gap between them, roughly 30 basis points, is among the narrowest on record. Some calculation methods show the premium at zero or negative.
In practical terms, investors are accepting equity-level risk for bond-level compensation. The last time that happened was late 1999.
The Calm Before the Storm
The headline index number obscures what Subramanian called "internal drama."
BofA's data shows the return gap between the top 20 percent and bottom 20 percent of technology stocks has widened to its largest since February 2000. Over the past three months, the spread between the top 10 percent and bottom 10 percent of all S&P 500 stocks hit its widest since the Covid-19 pandemic.
The top 10 companies in the index represent roughly 36 to 38 percent of its total weight, down from a peak of 41 percent in late 2025 but still nearly double the 20 percent average of the prior decade. And those 10 companies' share of index earnings, roughly 32 percent, lags their weight by a wide margin. Price has outrun profit.
Only 59 percent of S&P 500 constituents currently trade above their 200-day moving average, a level that places current breadth in just the 39th percentile of its historical range. The rally is narrow. The index looks healthy. The average stock does not.
All Bets on One Chip
The market's concentration reflects a single bet: that artificial intelligence will deliver revenue growth large enough to justify what companies are spending on it.
The numbers are staggering.
Google, Microsoft, Amazon and Meta are on pace to spend roughly $700 billion on capital expenditures in 2026, nearly double what they spent in 2025 and roughly four times their 2023 level. About 75 percent of that spending, approximately $450 billion, is tied directly to AI infrastructure: servers, GPUs, data centers.
BofA flagged one statistic in particular.
Capital expenditures by hyperscale cloud companies are approaching 100 percent of their operating cash flow by year-end 2026. In 2023, that ratio was roughly 40 percent. Amazon's free cash flow has already declined 95 percent on a trailing 12-month basis to $1.2 billion. To fund the buildout, the four hyperscalers raised $108 billion in debt during 2025 alone, with projections suggesting $1.5 trillion in debt issuance over the coming years.
Capital expenditures by hyperscale cloud companies are approaching 100 percent of their operating cash flow by year-end 2026
The bet is that AI revenue will materialize fast enough to justify the spending.
Microsoft's AI revenue is running at a $37 billion annual rate. Google Cloud's backlog has jumped past $460 billion. These are large numbers. Whether they are large enough is the open question.
Consensus analyst estimates project 13 to 15 percent S&P 500 earnings growth in both 2026 and 2027, heavily driven by AI monetization. If that growth arrives, the market's multiple might hold. If the revenue ramp disappoints by even a few quarters, two things happen simultaneously: earnings miss and the multiple built on those earnings expectations compresses. Subramanian's warning is, in essence, that the market has no margin for that kind of double hit.
If the revenue ramp disappoints by even a few quarters, two things happen simultaneously: earnings miss and the multiple built on those earnings expectations compresses
Will This Time be Different?
This is not the first time the CAPE has been above 30. But the current episode differs from its predecessors in ways that cut both directions.
The structural case for a bull market does have legs.
Corporate profit margins are near record highs, supported by asset-light technology business models and the growing share of S&P 500 revenue earned overseas (now roughly 40 percent). AI productivity gains, if they materialize, could justify multiples that would have been unsustainable in an earlier economy. The shift to passive indexing, which now represents more than half of total U.S. equity fund assets, creates persistent demand for the largest stocks regardless of their valuation.
The shift to passive indexing, which now represents more than half of total U.S. equity fund assets, creates persistent demand for the largest stocks regardless of their valuation
But those same structural factors amplify the downside.
Passive flows are price-insensitive: every dollar into an index fund buys the top 10 names in proportion to their weight, which raises their prices, which increases their weight, which attracts the next dollar. The feedback loop works in reverse. Outflows or forced rebalancing would hit the most concentrated names hardest.
BofA also noted that share buybacks have slowed, investment-grade corporate bond issuance has risen, and cash-generation capacity has stagnated. The financial engineering that supported equity prices during the low-rate era is losing potency.
History Seldom Repeats, But Rhymes
Since 1871, there have been only four episodes where the CAPE exceeded 30: the late 1920s, the late 1990s, late 2021 and now.
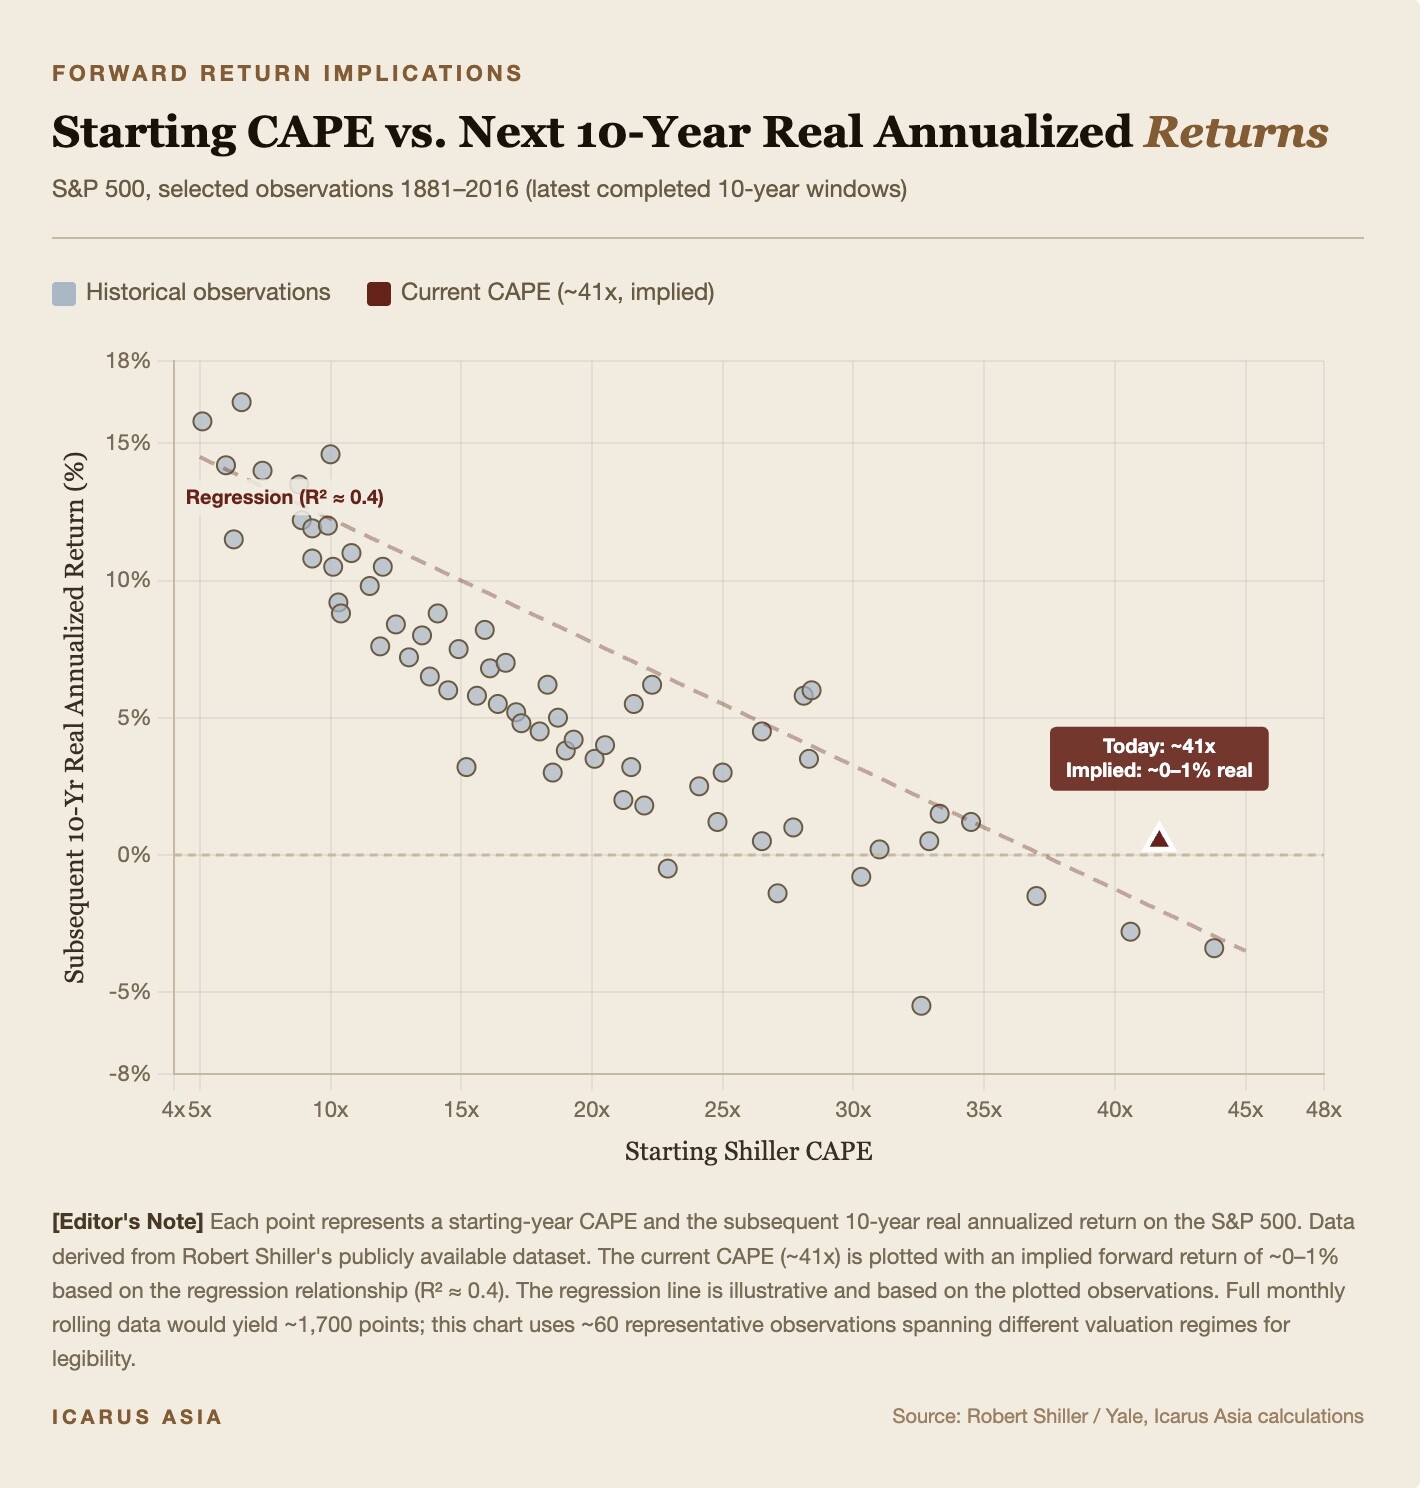
The September 1929 peak, at roughly 32.6, preceded the Great Depression and an 86 percent drawdown. The January 2000 peak, at 43.8, preceded a lost decade: the S&P 500 delivered negative 3.4 percent annualized real returns over the following 10 years. The November 2021 peak, at 38.6, preceded a 25 percent drawdown by October 2022.
The pattern is not deterministic.
Markets stayed expensive through much of the late 1990s before the crash. The 2021 episode, notably, saw stronger-than-expected returns over the following four years, driven by the AI productivity surge and resilient corporate margins. The CAPE did not "fail" as a predictor in that case; the correction may simply be delayed.
But the arithmetic is consistent across episodes.
Starting CAPEs above 30 have never produced strong 10-year forward returns. The best outcome from these levels was mediocre. The regression relationship between starting CAPE and subsequent 10-year real returns, with an R-squared of roughly 0.4, implies approximately 0 to 2 percent annualized real returns from today's starting point. The other 60 percent of the variance comes from rate paths, earnings surprises and policy shocks. The starting valuation sets the gravitational center.
When You Say Nothing At All
It is worth reading Subramanian's recommendation carefully. She is not calling for a crash. She is not telling clients to sell everything. BofA maintained its year-end S&P 500 target at 7,100, roughly 4 percent below Monday's close.
What she is saying is more subtle and, arguably, more useful. BofA sees "opportunities in individual S&P 500 constituents, but not in the market-cap-weighted index as a whole." The problem is concentration, not the economy. The problem is valuation, not earnings. The recommendation is to take profits, reduce passive exposure, and get more selective.
The recommendation is to take profits, reduce passive exposure, and get more selective
Citi's message was similar in spirit. The bank maintained its constructive year-end equity outlook while warning that further increases in its flag count would change its guidance on buying dips.
Both banks are saying the same thing in different ways: the market can stay expensive. Expensive markets have stayed expensive before. But the margin for error is thin when every valuation anchor is at extremes, the equity risk premium has vanished, the rally is narrow, and the single biggest bet in the market (AI spending) is being financed with debt and consuming nearly all of the cash flow of the companies making it.
But the margin for error is thin when every valuation anchor is at extremes, the equity risk premium has vanished
The Uncomfortable Math
For institutional investors, the math is uncomfortable but clear.
At a CAPE of 41.6, you are paying $41.60 for every dollar of normalized, inflation-adjusted earnings the S&P 500 has generated over the past decade. At a Buffett Indicator of 230-plus percent, the stock market is valued at more than $2.30 for every dollar the U.S. economy produces in a year. At an equity risk premium near zero, you earn almost nothing above Treasuries for bearing the volatility, drawdown risk and fundamental uncertainty of equities.
Any of the following could widen the risk premium and compress multiples: AI revenue disappointing by a few quarters. Inflation staying sticky above 2 percent. The Fed keeping rates higher for longer. A credit event in the $2-trillion-plus private credit market. A trade-war escalation. A geopolitical shock.
None of these are priced as meaningful risks at current equity valuations. All of them are plausible.
BofA's 7,100 year-end target implies the market is about 4 percent overvalued from here. That is the benign scenario. A CAPE compression to 32 (still well above the historical average) would imply a 20 to 25 percent drawdown. A compression to 22 to 25 (typical of recessionary troughs since 2000) would mean 35 to 45 percent.
What Comes Next
The most likely near-term outcome is that nothing dramatic happens immediately. Markets at extremes can stay extreme for quarters. The late 1990s CAPE exceeded 30 for nearly four years before the crash. The current rally has survived tariff scares, rate shocks and a brief drawdown in early 2025. The momentum, the passive flows and the AI narrative remain powerful forces.
But the warning signals are now coming from inside the house. When BofA and Citi, institutions that earn fees from bullish clients, both tell those clients to pull back, the signal carries weight precisely because it cuts against their commercial interest.
The warning signals are now coming from inside the house
Subramanian put it plainly. The S&P 500's strong advance is "masking drama beneath the market's surface." Extreme price moves may be a sign that instability is increasing.
The market can stay expensive. The question is whether investors are being compensated for the risk that it won't.
Right now, the answer is no.
The author is the Head of Research and Analysis at Icarus Asia, a risk and advisroy firm based in Hong Kong.
Sources
Shiller CAPE ~41.6x (early June 2026) — Multpl.com via Robert Shiller / Yale. Multpl reports 41.57 as of June 5; implied ~41.6 after the S&P 500's +0.30% gain on June 8. Robert Shiller's original data available at econ.yale.edu/~shiller/data.htm. Minor variations exist across providers due to exact calculation windows; GuruFocus reports ~39.8.
CAPE all-time high 43.8x (Jan 2000) — Multpl.com historical table (records 44.19 for Dec 1999; 43.77 for Jan 2000).
CAPE median since 1871 = 16.1x — Multpl.com full historical series (reports 16.09).
155-year CAPE history — Robert Shiller, Irrational Exuberance (Yale, data from 1871).
Buffett Indicator ~230–239% (early Jun 2026) — GuruFocus (235.9%, May 2026); Advisor Perspectives (229.7%, Q1 GDP second estimate); MacroMicro (231.7%, June 7, 2026). Range reflects methodological differences across providers; we cite the full range throughout.
Buffett's 120% threshold — Warren Buffett, "Warren Buffett on the Stock Market," Fortune, December 10, 2001.
Dot-com Buffett Indicator peak ~137% — GuruFocus historical chart; CurrentMarketValuation.com.
S&P 500 close 7,405.73 (June 8, 2026) — S&P Dow Jones Indices; Yahoo Finance; CNBC.
BofA: 70% of bear-market indicators triggered — Savita Subramanian, BofA Securities equity strategy note, June 5, 2026. BofA and Citi research notes are not publicly available; data points cited from secondary coverage in Bloomberg, Seeking Alpha, TipRanks, and TheStreet.
BofA: S&P 500 overvalued on 17 of 20 metrics — Subramanian, BofA Securities, June 5, 2026.
BofA: year-end target 7,100 — Subramanian, BofA Securities, June 5, 2026.
Citi Bear Market Checklist: 11.5 of 18 U.S. flags — Citigroup equity strategy, June 6, 2026; highest since 2008.
Equity risk premium compressed to ~0–30 bps — Damodaran / NYU Stern; MacroMicro; ECM Source. Forward earnings yield ~4.6% per FactSet and S&P Dow Jones. 10-year Treasury yield ~4.3% per U.S. Treasury / FRED (Federal Reserve Bank of St. Louis).
Top 10 S&P 500 weight ~36–38% — AhaSignals (35.59%, April 2026); Pensions & Investments (~37%, mid-2026); S&P (~38%, January 2026). Peaked at ~41% in late 2025.
Top 10 share of index earnings ~32% — BofA Securities; FactSet, early 2026.
~59% of S&P 500 above 200-day moving average (39th percentile historically) — BofA Securities; MarketInOut.com, early June 2026.
Tech return dispersion widest since February 2000 — BofA Securities (Subramanian note), June 5, 2026.
Hyperscaler capex ~$700 billion in 2026 (~75% AI-related) — CNBC; Tom's Hardware; company filings (Google, Microsoft, Amazon, Meta). 2026 projected.
Capex/operating cash flow approaching 100% by year-end 2026 — BofA Securities (vs. ~40% in 2023).
Amazon free cash flow declined 95% to $1.2 billion trailing 12 months — Amazon 10-Q (Q1 2026); Seeking Alpha.
Hyperscalers raised $108 billion in debt in 2025 — BofA Securities; Bloomberg.
Microsoft AI revenue ~$37 billion annual run rate — Microsoft earnings (Q3 FY2026); CNBC.
Google Cloud backlog exceeding $460 billion — Alphabet earnings (Q1 2026); Reuters.
Consensus S&P 500 EPS growth 13–15% for 2026 and 2027 — FactSet; Bloomberg consensus, as of early June 2026.
Passive indexing exceeding 50% of U.S. equity fund assets — Morningstar; Investment Company Institute (year-end 2025).
September 1929 CAPE ~32.6; 86% drawdown — Multpl.com; Robert Shiller data.
January 2000: negative 3.4% annualized real returns over the following 10 years — Shiller data; S&P Dow Jones (total return, CPI-adjusted), 2000–2010.
November 2021 CAPE 38.6; 25% drawdown by October 2022 — Multpl.com; S&P Dow Jones (peak-to-trough).
CAPE vs. 10-year returns R-squared of ~0.4 — Robert Shiller; Star Capital; Icarus Asia calculations. Regression on 1871–2016 starting CAPEs.
CAPE compression to 32 implies 20–25% drawdown — Icarus Asia estimate based on current S&P 500 level.
CAPE compression to 22–25 implies 35–45% drawdown — Icarus Asia estimate based on recessionary trough range (2002, 2009, 2020).
Disclaimer
This article is for informational purposes only and does not constitute investment advice.
All data sourced from public filings, government statistical agencies, and third-party data providers as noted. Forward-looking estimates are Icarus Asia Research estimates unless otherwise sourced. Past performance is not indicative of future results. All valuation metrics are subject to revision as underlying data is updated.