

Above Five, Then Back Below
The 10-year Treasury touched its highest yield since 2007 on Monday. Buyers showed up again. A term premium near 0.9 percentage point means the next test will be harder to pass.
Unlike the October 2023 test, a durable reversal this time needs more than an attractive nominal yield. Investors need to see the energy shock fade, the Fed's response prove credible, or growth weaken enough to pull expected short rates down.9 Five percent is a powerful psychological threshold. It is not a law of markets. What matters is whether the move is orderly and growth-led, or disorderly and driven by inflation and fiscal risk.
A Familiar Level, an Unfamiliar Backdrop
Benchmark 10-year Treasury yields rose above 5% on Monday for the first time since October 2023, touching an intraday high of 5.014% before buyers pushed the yield back under the threshold.2 3 The move put the note at levels not otherwise seen since July 2007; a rise past roughly 5.02% would have marked a new high for the entire post-financial-crisis period.10 13
The reversal is the part worth watching. In October 2023, the 10-year briefly touched about 5.02% and closed near 4.84% the same day; it fell to roughly 3.79% by year-end as investors covered short positions and bought duration.12 13 The 2026 test produced a smaller same-day retreat, to about 4.96% per TradingEconomics, which suggests 5% still functions as a demand trigger. It has not yet produced the kind of capitulation in bearish positioning seen three years earlier.20
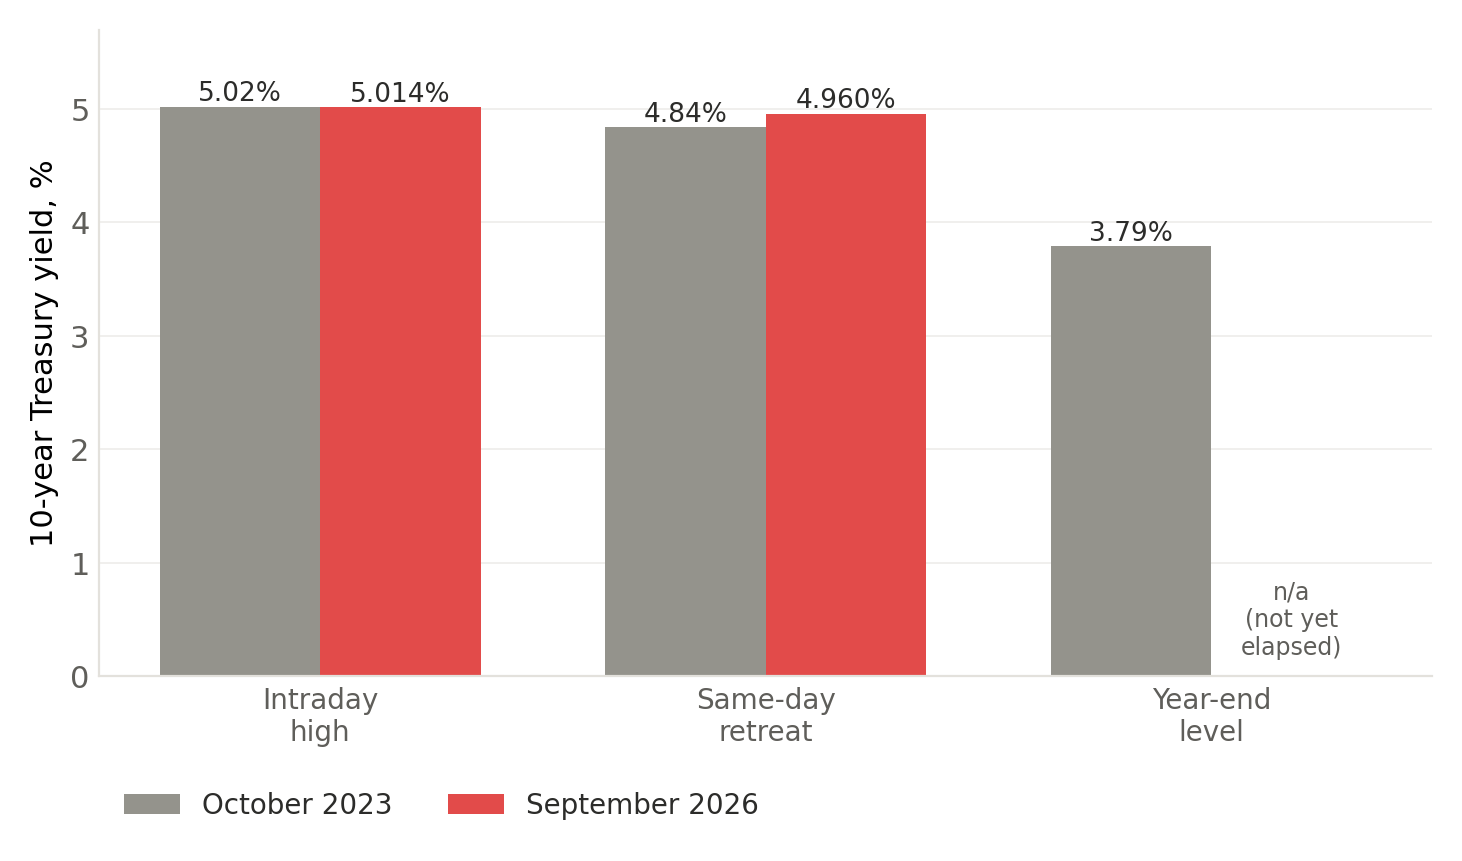
Figure 1: Intraday high and same-day retreat are directly comparable across both episodes. The October 2023 year-end level (3.79%) reflects nearly three months of subsequent disinflation and Fed pivot expectations. There is no equivalent data point yet for 2026, since that period has not elapsed. Sources: Wolfstreet, Investopedia, TradingEconomics.12 13 20
What Five Percent Is Actually Made Of
A 10-year nominal yield is, approximately, the expected average short-term policy rate over the life of the bond plus a term premium: the extra compensation investors demand for the risk of holding a fixed-rate, long-duration asset rather than rolling short-term paper.14 The Dallas Fed put the 10-year term premium at roughly 60 basis points in June; by early September, the New York Fed's ACM model estimate had risen to about 89 basis points.14 6
The two estimates come from different models (the Dallas Fed's term-funding-premium framework and the New York Fed's ACM model), so the move from about 60 basis points to about 89 basis points reflects both a genuine increase in duration risk and some methodological difference between them. The direction matters more than the precise size of the move.
The distinction matters for what comes next. A yield increase driven by stronger expected growth can coexist with healthy earnings and stable credit performance. A yield increase driven by inflation or fiscal risk premium is more destabilizing: it raises discount rates without guaranteeing stronger nominal cash flows, and it reduces the odds of a near-term Fed easing cycle.
Oil, Then Inflation, Then the Fed
Energy triggered it first. Crude oil climbed above $100 a barrel in the U.S. while Brent approached the high $90s to $100 range, sparking a global bond selloff on concern that higher energy costs would feed into broader pricing expectations.15 1 August's CPI report reinforced the concern: headline CPI rose 0.4% month over month and 3.4% year over year, with gasoline up 3.9% for the month and the energy index up 16.3% from a year earlier. Core CPI, at 0.3% month over month and 2.4% year over year, was less alarming. But the headline acceleration was enough to make a near-term Fed hike look likely.4 16
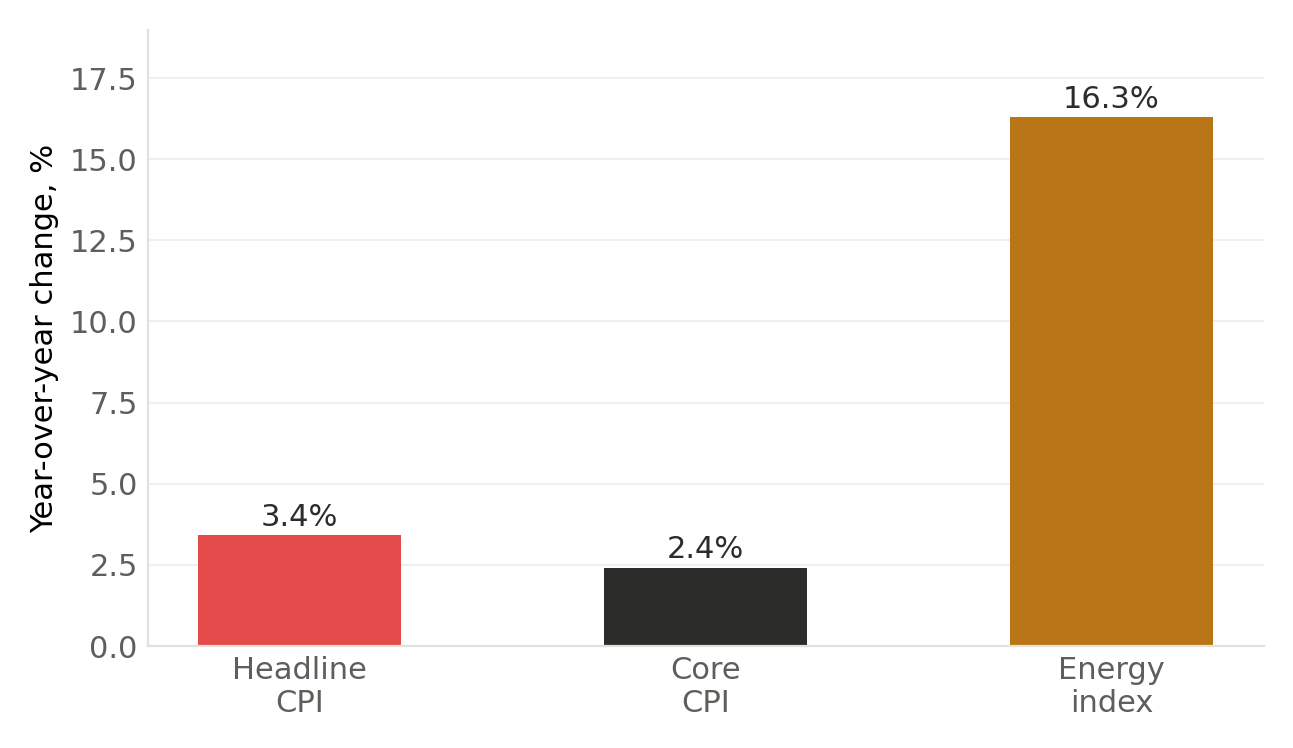
Figure 2: Headline and core figures are seasonally adjusted 12-month changes; the energy index is the broader BLS energy category, not the narrower gasoline sub-index. Source: U.S. Bureau of Labor Statistics, August 2026 CPI release.16
Economists moved fast after that. In the wake of the inflation release, 85% of those surveyed by Reuters expected a 25-basis-point increase at the September 15–16 Fed meeting, and futures markets priced close to a 90% probability of a hike plus roughly four more increases by July 2027.9 That repriced both components of the yield at once: the expected path of short rates, and the uncertainty premium investors attach to how far and how fast the Fed will actually move.
Why the Rally Didn't Come
The fiscal backdrop explains why the 10-year did not rally decisively on approach to 5%. The Congressional Budget Office projects a $1.9 trillion federal deficit for fiscal year 2026, equal to 5.8% of GDP, with debt held by the public at 101% of GDP. Net interest outlays are projected to exceed $1 trillion in 2026 and to rise from 3.3% of GDP this year to 4.6% by 2036.5 17
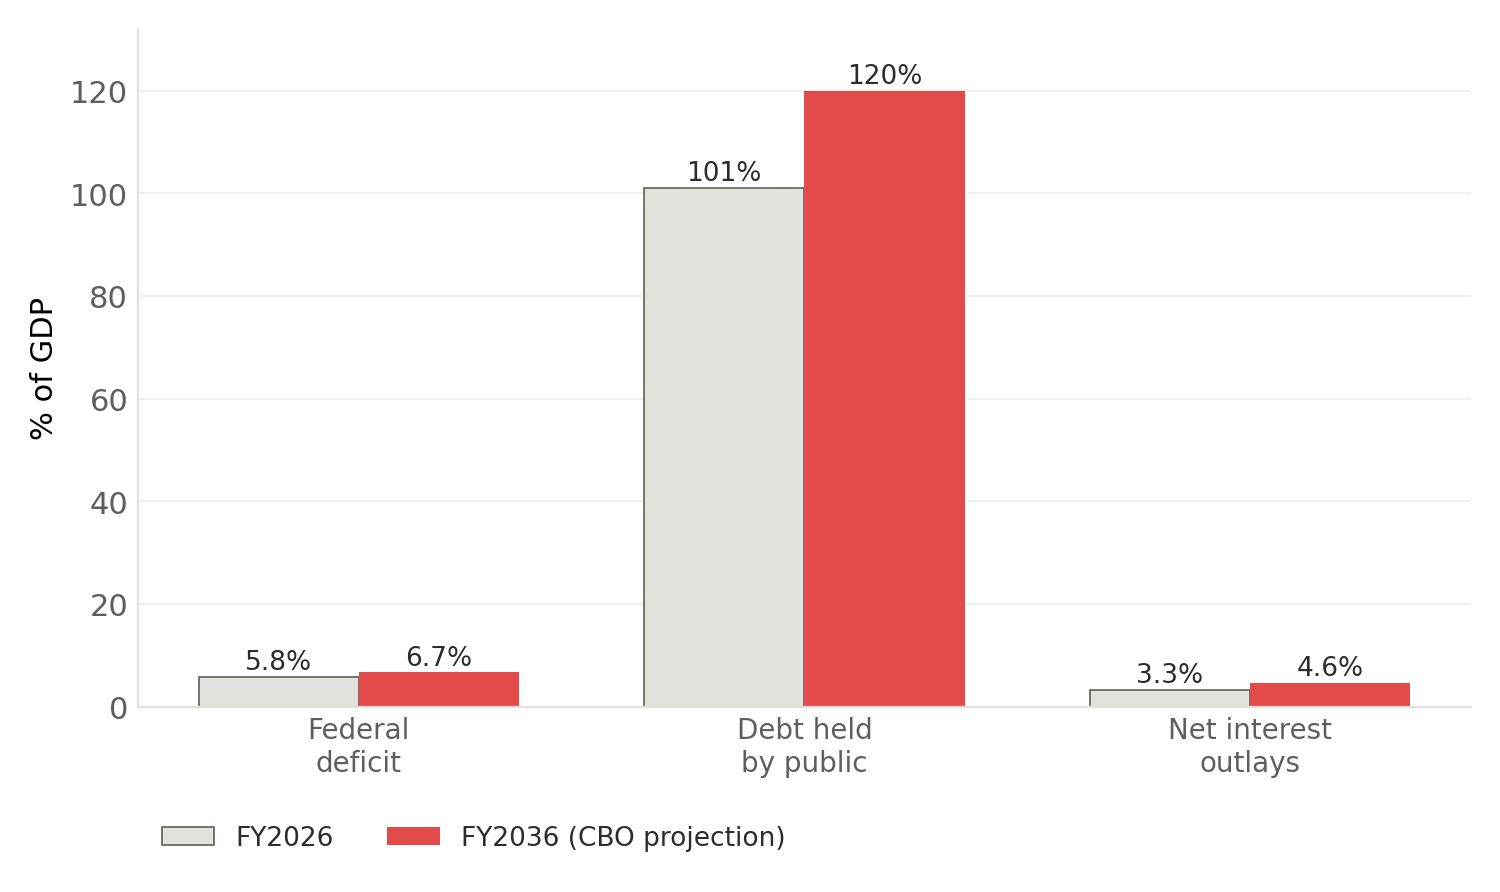
Figure 3: All figures are CBO baseline projections and subject to revision in future reports. Debt held by the public is shown on the same percent-of-GDP axis as the deficit and interest series for comparability; note the difference in scale. Source: Congressional Budget Office, The Budget and Economic Outlook: 2026 to 2036.5 17
These numbers create both a supply problem and a risk-premium problem. Treasury has to place a large volume of securities even in a non-recessionary year, and investors have to judge whether higher interest costs will widen future deficits and require still more issuance. CBO projects debt held by the public reaching 120% of GDP by 2036 and the deficit widening to 6.7% of GDP despite a smaller primary deficit, a sign that interest expense itself is increasingly driving the debt trajectory.17
Auction sizes illustrate the scale of what the market has to absorb. The August refunding offered $125 billion across 3-, 10- and 30-year maturities, including a $42 billion 10-year note, and raised about $28.7 billion in new cash from private investors.18 19 Treasury has said nominal coupon and floating-rate-note auction sizes should hold steady for at least several quarters. But "stable" at today's elevated debt stock still means substantial recurring duration supply.18
Private borrowing adds to the competition for capital. Heavy corporate issuance tied to artificial-intelligence infrastructure is running alongside sovereign borrowing, which matters because the marginal Treasury buyer is comparing duration not just against equities and cash, but against investment-grade credit offering additional spread. Stronger private credit demand can push up the yield required to clear a Treasury auction.1
Why 2026 Is a Harder Test Than 2023
| Dimension | October 2023 | September 2026 |
|---|---|---|
| Immediate narrative | "Higher for longer," strong activity data, rapid six-month selloff | Oil shock, firm inflation, renewed Fed-hike expectations |
| Price action at 5% | Reversed from ~5.02% to ~4.84% same day; ~3.79% by year-end | High of 5.014%, retreat only to the high-4.9% area |
| Policy direction | Hiking cycle near its end; disinflation opened a path to easing | Markets pricing the first hike since 2023, and possibly more |
| Inflation impulse | Decelerating from post-pandemic peaks | Headline CPI 3.4%; energy index up 16.3% year over year |
| Fiscal / term-premium backdrop | Supply concerns present, but short covering dominated | Debt above 100% of GDP; term premium near 0.9 percentage point |
| Condition needed for a rally | Attractive yield plus evidence of cooling growth | Attractive yield likely needs confirmation from oil, inflation, Fed credibility, or weaker growth |
The key difference is the policy path ahead. In 2023, 5% ultimately proved restrictive enough to slow the economy and pull in buyers as the tightening cycle matured. In 2026, the market is confronting a fresh inflation impulse before it has any confidence that policy is restrictive enough, which means 5% may generate tactical demand without yet marking the cycle high. A second difference is composition: when the term premium is elevated and rising, a weaker economy does not automatically produce a proportional bond rally, because fiscal supply and inflation uncertainty can offset a lower expected path for short rates. That raises the odds of a "bear steepening" episode, in which long yields rise relative to the front end as investors demand more compensation for duration.
Where a Sustained 5% Actually Bites
| Channel | Mechanism | Likely effect of a sustained 5%+ yield |
|---|---|---|
| Housing | Mortgage pricing tracks the 10-year plus a spread for prepayment, credit and volatility risk | 30-year fixed mortgage rates moved above 7% as the 10-year approached 5%, worsening affordability and turnover21 |
| Equities | Higher discount rates reduce the present value of distant cash flows | Greatest pressure on long-duration growth names, highly levered firms, and disappointing earnings10 2 |
| Corporate credit | Treasury yields set the risk-free floor under corporate coupons | Higher all-in refinancing costs even with stable spreads; weaker borrowers more exposed at maturity walls |
| Federal finances | New and maturing debt reprices gradually at higher rates | Rising interest expense compounds deficits; CBO already projects >$1T net interest in 20265 |
| Banks | Higher yields lift reinvestment income but reduce the market value of existing holdings | Mixed earnings effect; pressure concentrated in banks with unhedged duration or unstable deposits |
| Dollar | Higher relative rates support the dollar; a fiscal-risk-driven move can undercut confidence instead | Direction depends on whether the move reflects Fed credibility or a rising sovereign risk premium |
| Emerging markets | Higher Treasury yields raise the global discount rate and compete for dollar capital | Tighter financial conditions, concentrated in high-beta currencies and weak-reserve external borrowers |
Housing is the fastest domestic channel. As the 10-year moved toward 5%, the average 30-year fixed mortgage rate crossed 7%.21 Persistently high mortgage rates suppress transaction volume, weaken affordability, and reinforce the "lock-in" effect for homeowners still holding older, low-coupon mortgages.22 23
Equity sensitivity depends on earnings. The S&P 500 has stayed resilient even as the 10-year approached 5%, with strong profit growth offsetting some valuation compression. That dynamic can persist while nominal growth and earnings hold up. It turns unstable if higher yields coincide with weaker earnings, wider credit spreads, or margin compression from the oil shock itself.11 24 The valuation arithmetic is already demanding: at the end of June, one estimate placed the S&P 500's trailing earnings yield near 4.11% against a 4.38% 10-year yield, a negative gap that puts the burden of proof on equity valuations to justify a lower current earnings yield with durable growth.25
Buybacks Without Shock and Awe
Treasury raised the size of its long-end liquidity-support buybacks from a maximum of $2 billion to at least $4 billion per operation, effective September 9, and Secretary Scott Bessent later signaled purchases could go higher. A September operation as large as $6 billion was announced.8 26 The market's muted reaction is itself informative.27
Buybacks are not quantitative easing. They exchange one government liability for another and are meant to improve market liquidity and functioning, not to eliminate the underlying supply that private investors ultimately have to finance. Absent lower net borrowing or a shift in the maturity profile, their effect falls mainly on liquidity and auction dynamics, not on the long-run equilibrium yield. If markets came to see larger buybacks as an attempt to target a specific yield rather than to smooth liquidity, that could increase the risk premium rather than reduce it, by raising doubts about the consistency of debt-management policy.
Four Paths From Here
Back to the high 4s
Oil retreats, headline inflation decelerates, the Fed delivers a credible but limited response, and growth data soften. A decisive move would show up as lower two-year yields, softer breakevens and a stable-to-declining term premium, not just a one-day risk-off rally.
4.85%–5.20%
Inflation stays above target without re-accelerating, the Fed tightens gradually, and auctions clear without disorder. Carry buyers emerge above 5%, while fiscal and issuance concerns cap rallies below the upper-4% area. These are high yields that constrain activity without forcing a policy reversal.
5.25%–5.50%
Plausible if oil stays elevated, inflation expectations broaden, the Fed looks behind the curve, or long-end auctions show weak demand. One strategist has cited a 5.5% risk case amid sustained selling.1 Most concerning if paired with a weaker dollar, which would suggest investors are pricing fiscal or inflation risk rather than rewarding growth.
Not the level: the pattern
The dangerous outcome isn't a specific yield. It's a rapid rise paired with wider swap spreads, poor auction tails, falling equities, a weaker dollar and rising credit spreads at the same time, a cross-asset pattern signaling impaired confidence in duration absorption, distinct from an orderly move to 5.25% with firm equities and a stronger dollar.
What This Means for Portfolios
At roughly 5%, the 10-year offers real nominal carry and a credible hedge against disinflation or recession, but it is not automatically low-risk. Using a modified duration near eight years as a rough market convention, a 50-basis-point rise in yield implies an approximate 4% price decline before carry and convexity, and a comparable decline in yield produces a similar-sized gain — illustrative math based on standard duration arithmetic, not a specific security.
A staged entry into duration is more defensible than treating 5% as a single binary signal. An initial allocation captures improved carry and potential convexity; further additions can be conditioned on oil, inflation breakevens, auction performance, and evidence that the term premium has stopped climbing. Investors focused on income may prefer intermediate maturities or a barbell structure until the long-end supply premium stabilizes.
For equities, the more useful screen is balance-sheet and cash-flow duration rather than a blanket call on the asset class. Companies generating current free cash flow, with low refinancing needs and real pricing power, should tolerate a higher sovereign discount rate better than growth stories funded with external capital, provided earnings revisions stay positive.24 For emerging markets, a 5% Treasury benchmark raises the required local-currency carry and sharpens sensitivity to oil, external balances and reserve adequacy; commodity importers with weak fiscal positions face the toughest combination of higher energy bills, imported inflation and tighter dollar liquidity.
Indicators to Monitor
- Fed reaction
Size of the September move, forward guidance, and whether the Committee treats the oil shock as temporary or as a risk of second-round inflation.9 - Oil persistence
A reversal in crude removes the immediate catalyst; sustained triple-digit oil keeps both headline inflation and breakeven risk elevated.15 - Inflation composition
Headline is 3.4%, core is 2.4%: a broadening from energy into services and wages would be more consequential than gasoline alone.4 16 - Term premium
The early-September estimate near 0.89 percentage point is the key gauge of whether the selloff is structural or largely a Fed-path repricing.6 - Auction quality
Tails, bid-to-cover ratios, dealer takedown and indirect-bidder participation at 10-, 20- and 30-year auctions will test real-money absorption. - Curve shape
A front-end-led selloff signals Fed repricing; long-end underperformance signals term-premium and fiscal stress. - Cross-asset confirmation
A stronger dollar with resilient credit points to a growth/policy move; a weaker dollar with wider credit and lower equities points to a confidence shock. - Mortgage spread
Even if the 10-year stabilizes, elevated volatility and prepayment uncertainty can keep mortgage rates well above the Treasury benchmark.23
A Test, Not Yet a Breakout
The first move through 5% was a test, not a breakout. Buyers defended the threshold, market functioning stayed orderly, and the yield pulled back from its intraday high. But the combination of an oil-driven inflation shock, a likely Fed hike, a term premium near 0.9 percentage point and a deficit close to 6% of GDP makes this episode more structurally challenging than the October 2023 spike.2 3 5 6 9
Repeated closes above the 2023 high, especially alongside a bear-steepening curve and weak auctions, would signal that 5% is no longer resistance, but the floor of a new, higher-yield regime.
Appendix A · Analyst Note
Prepared by: Icarus Asia Research
Report date / version: September 14, 2026 · v1.0
Methodology: Yield decomposition (expected short rate + term premium) applied to publicly reported market data, Federal Reserve model estimates (Dallas Fed term-funding premium, New York Fed ACM model), CBO baseline fiscal projections, and BLS inflation data. Scenario ranges are Icarus Asia's own framing of plausible paths, not point forecasts.
Key assumptions: Modified duration of ~8 years used for illustrative price-sensitivity arithmetic in the positioning section; this is a market convention, not a specific security's actual duration. Term-premium comparison across June and September estimates spans two different modeling methodologies (Dallas Fed vs. New York Fed ACM); the direction of travel is the more reliable signal than the precise delta.
Appendix B · Primary Source Verification
| # | Source | Type | Date | Claims supported |
|---|---|---|---|---|
| 1 | Aggregated research brief (UST-10Y-year-5.md) | Research aggregator | Sept 2026 | Background synthesis; AI infrastructure borrowing; strategist 5.5% risk case |
| 2 | Reuters, "US 10-year yields reach 5%, highest since 2023" | News wire | Sept 14, 2026 | Yield breach above 5%, highest since October 2023 |
| 3 | CNBC / Tradeweb, US10Y quote page | Market data | Sept 14, 2026 | Intraday open (4.955%), high (5.014%), low (4.934%) |
| 4 | U.S. Bureau of Labor Statistics, CPI Home | Government statistics | Aug 2026 | General CPI reference data |
| 5 | Congressional Budget Office, The Budget and Economic Outlook: 2026–2036 | Government report | 2026 | FY2026 deficit ($1.9T / 5.8% GDP), debt held by public (101% GDP), net interest outlays |
| 6 | FRED, Term Premium on a 10-Year Zero Coupon Bond (THREEFYTP10) | Federal Reserve data series | Sept 4, 2026 | 10-year term premium estimate (~0.89pp) |
| 7 | CNBC, "U.S. Treasury yields: investors eye key inflation data" | News | Aug 10, 2026 | Early oil/yield linkage ahead of CPI |
| 8 | U.S. Treasury, Press release (sb0607) | Government press release | Sept 2026 | Increased long-end liquidity-support buyback sizes to $4B minimum |
| 9 | Reuters, "Fed rate hike on Wednesday now likely, say economists" | News wire | Sept 14, 2026 | 85% of economists expect a hike; futures pricing for Sept 15–16 meeting |
| 10 | Business Insider, "Key Bond Yields Are Inching Toward 5%" | News | Sept 2026 | Framing of 5% as a market-watched level; equity valuation pressure |
| 11 | CNBC, "10-year Treasury yield hits 5% for the first time since 2023" | News | Sept 14, 2026 | S&P 500 resilience near record highs alongside rising yields |
| 12 | Wolfstreet, "The 10-Year Treasury Yield Briefly Makes it over 5%" | Market commentary | Sept 14, 2026 | October 2023 comparison; historical context on 5% as a level |
| 13 | Investopedia, "10-Year Treasury Yield Breaches 5% Before Retreating" | News | Sept 2026 | Highest since July 2007; October 2023 reversal data (5.02% to 4.84%, 3.79% year-end) |
| 14 | Dallas Fed, "Term funding premium: Time is money" | Federal Reserve research | June 2026 | Term premium definition; ~60bp June estimate |
| 15 | Morningstar / Dow Jones, "U.S. 10-Year Treasury Yield Nears 5% as Oil Fuels Inflation Fears" | News | Sept 2026 | Oil-driven global bond selloff |
| 16 | U.S. Bureau of Labor Statistics, CPI Summary, August 2026 | Government statistics | Aug 2026 | Headline CPI 3.4% YoY / 0.4% MoM; core 2.4% YoY / 0.3% MoM; energy +16.3% YoY; gasoline +3.9% MoM |
| 17 | Congressional Budget Office, The Budget and Economic Outlook: 2026–2036 (alt. edition) | Government report | 2026 | Debt-to-GDP path to 120% by 2036; deficit widening to 6.7% of GDP |
| 18 | U.S. Treasury, Quarterly Refunding Statement (sb0590) | Government press release | 2026 | $125B August refunding across 3-, 10-, 30-year maturities; forward guidance on auction sizes |
| 19 | Econolens, "Treasury's August Refunding: $125 Billion Raised" | Market commentary | 2026 | $42B 10-year note; ~$28.7B new cash raised from private investors |
| 20 | TradingEconomics, US 10-Year Treasury Note Yield | Market data | Sept 14, 2026 | Yield eased to 4.96% on September 14, 2026 |
| 21 | CNBC, "The Fed is likely to raise interest rates as inflation persists" | News | Sept 14, 2026 | 30-year fixed mortgage rate crossing 7% |
| 22 | Nevada Real Estate Group, "How the 10-Year Treasury Moves Mortgage Rates" | Industry blog | 2026 | 10-year touching 4.91% on Sept 10, 2026; mortgage-rate linkage |
| 23 | Brookings, "High mortgage rates are probably here for a while" | Policy research | 2026 | Historical mortgage-Treasury spread analysis |
| 24 | Benzinga, "Why Stocks Could Survive A Fed Hike And 5% Treasury Yields" | News | Sept 2026 | S&P 500 resilience amid $100 oil and rising yields |
| 25 | CurrentMarketValuation.com, "Earnings Yield Gap" | Market data / model | June 2026 data | S&P 500 trailing earnings yield (~4.11%) vs. 10-year yield (4.38%) |
| 26 | Reuters, "Treasury's Bessent says upsized bond buybacks could increase further" | News wire | Aug 20, 2026 | Buyback increase to $4B minimum; potential for further increases |
| 27 | Axios, "Treasury buyback fails to shock and awe the bond market" | News | Sept 10, 2026 | Muted market reaction to upsized buyback announcement |
Data provenance. Market levels, CPI figures, CBO projections and Federal Reserve model estimates in this report are drawn from the primary and secondary sources listed in Appendix B, current as of their publication dates above. Scenario ranges and the duration-sensitivity illustration in Section 09 are Icarus Asia's own analytical framing, not third-party forecasts.
Forward-looking statements. This report contains forward-looking statements based on current assumptions and estimates. Actual outcomes may differ materially. Icarus Asia makes no representation as to the completeness or accuracy of this analysis. This is not investment advice.
Conflicts of interest. Icarus Asia Research has no investment banking relationship with any issuer mentioned in this report. No positions are held in the securities discussed. Readers should independently verify all information before making investment decisions.