
News · Rates & FX · Hong Kong, US
Are Bonds Still a Hedge? A Market Signal Is Casting Doubt
A signal buried in market data is flashing again -- and this time, inflation isn't letting up.
A closely watched relationship between U.S. stocks and Treasury bonds has shifted back toward dangerous territory through early 2026, reviving fears that the safety net built into traditional balanced portfolios may be fraying once more.
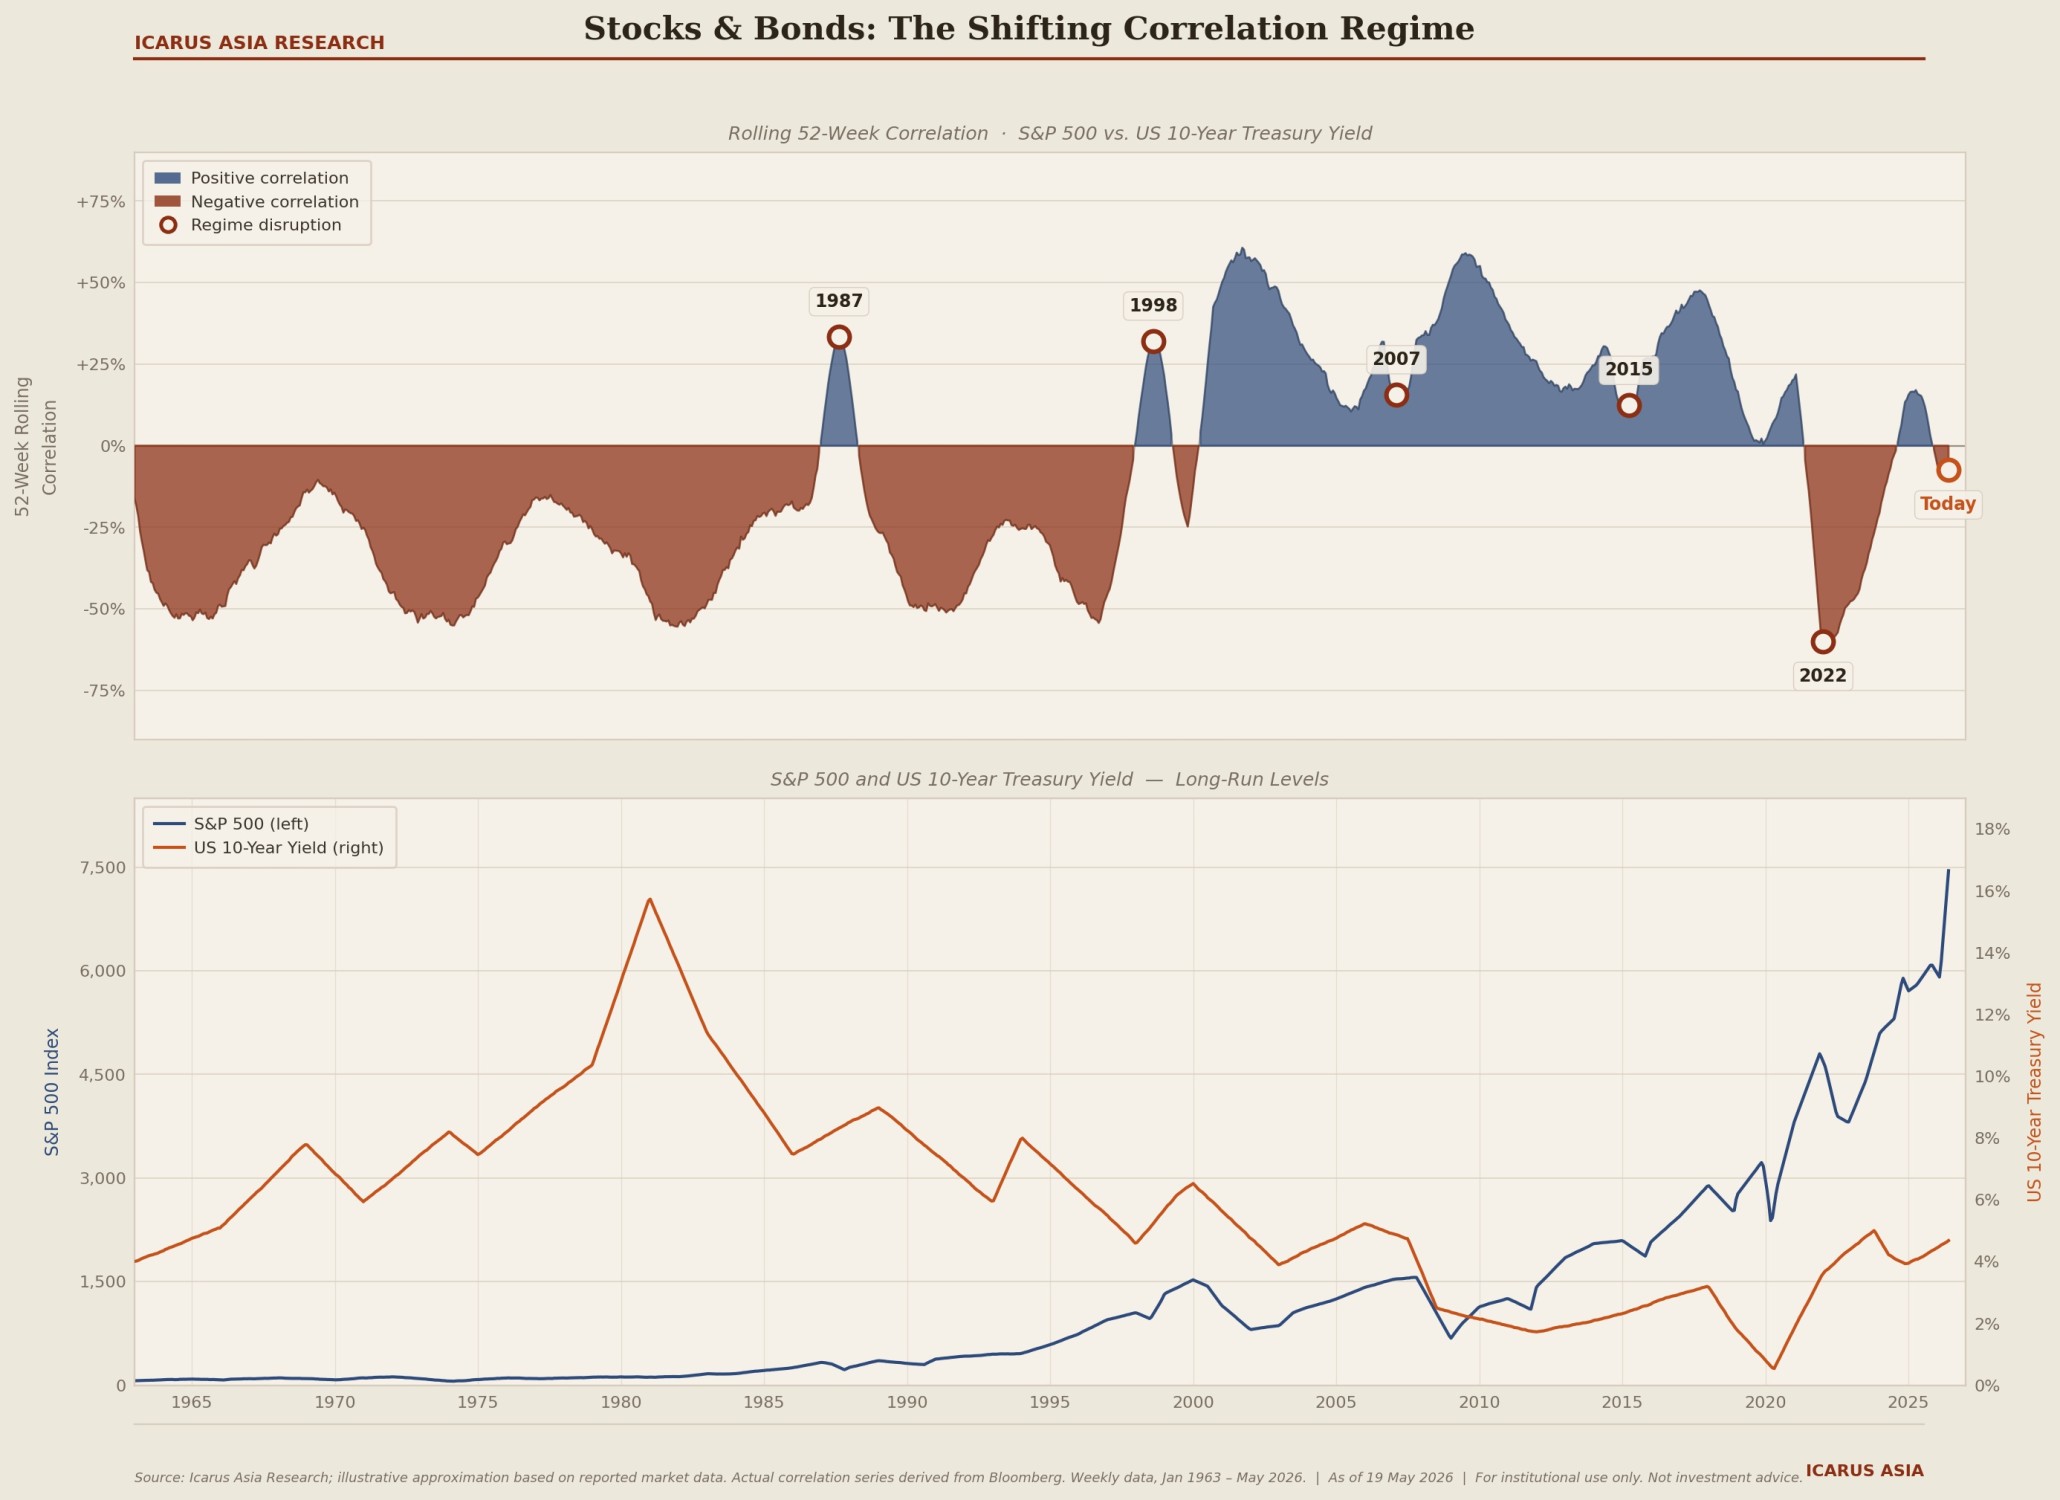
The rolling 52-week correlation between stock prices and Treasury yields — a measure of how the two asset classes move relative to each other — has turned sharply negative after holding a positive stance since April 2025. The shift, documented in a new note from Hong Kong-based Icarus Asia Research, tracks a pattern that has preceded some of the most destabilizing moments in modern markets.
The proximate causes are familiar: inflation that refuses to retreat.
Headline CPI hit 3.8% year-over-year in April 2026, a realized figure that surprised forecasters banking on further disinflation. Core personal consumption expenditures — the Federal Reserve's preferred inflation gauge — ran at roughly 4.3% annualized between December 2025 and March 2026, according to nowcast estimates from the University of Michigan's RSQE May 2026 economic forecast. That figure is not yet finalized by the Bureau of Economic Analysis. Meanwhile, the 10-year Treasury yield climbed to 4.668% on May 19, 2026, a 52-week high, as bond markets priced in a Fed unwilling to blink.
The Federal Reserve has held its benchmark funds rate at 3.50% to 3.75% for three consecutive meetings, signaling that the rate-cutting cycle that briefly buoyed markets in late 2025 has effectively stalled.
Will History Repeat Itself?
What makes this moment more than a routine market wobble is the history embedded in the correlation itself.
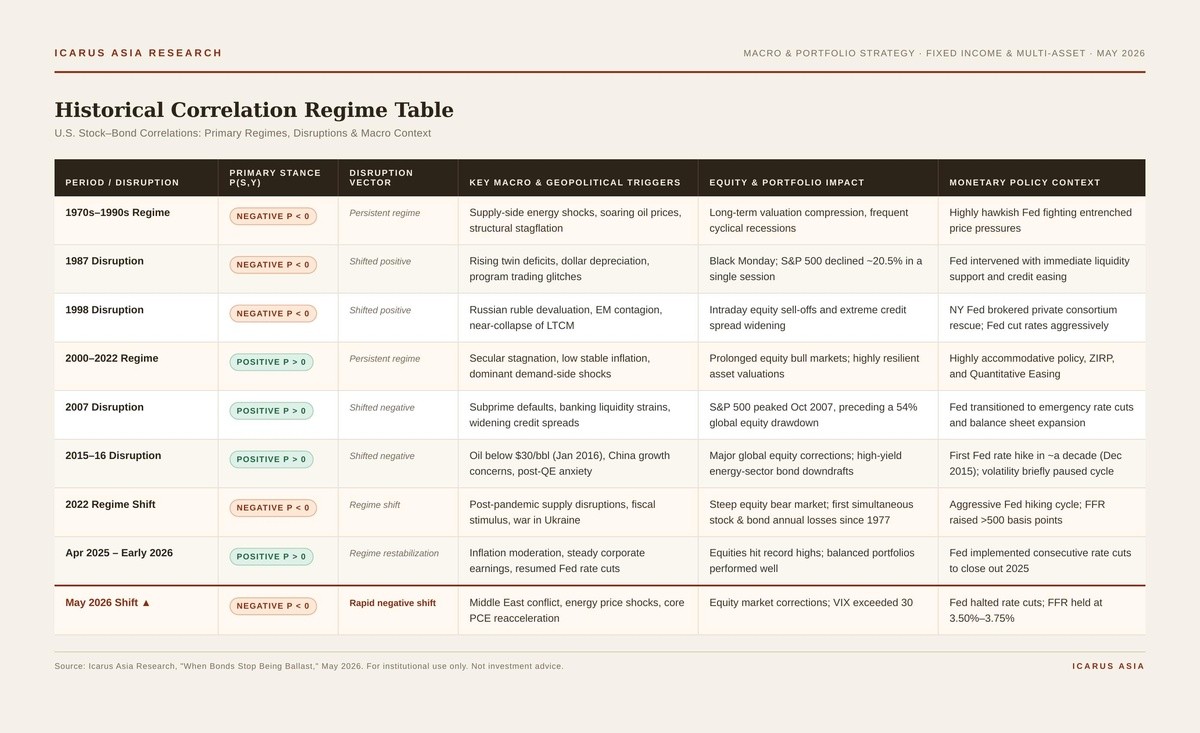
From the 1970s through the late 1990s, stocks and bonds moved in opposite directions. Inflation was the dominant force — when it rose, it punished equities through higher discount rates while also pushing bond yields up and prices down. The two asset classes moved together in their losses, but that negative stock-yield correlation meant that bonds, perversely, cushioned balanced portfolios because when growth fears eased, both recovered.
That structure broke decisively around 2000.
As inflation fell dormant for more than two decades, equities and bond yields began moving in tandem — both rising when economic conditions strengthened, both softening when recession fears crept in. The 60/40 portfolio, the backbone of institutional asset allocation, thrived in this environment. Bonds became the reliable counterweight to equity volatility.
Then came 2022.
Post-pandemic supply chain disruptions, a massive fiscal stimulus overhang, and a war in Ukraine drove inflation to a 40-year peak of 9.1%. The Fed responded with its most aggressive hiking cycle since the Volcker era, raising rates by more than 500 basis points. For the first time since 1977, stocks and bonds both posted simultaneous annual losses. The correlation flipped positive — meaning the hedge had stopped working — and the damage to 60/40 investors was severe.
"The correlation between U.S. equity prices and bond yields is signaling another risk-off period may be lurking," said Gina Martin Adams, chief market strategist at HB Wealth, a national fiduciary wealth advisory firm in a post from her verified account on LinkedIn. "Inflation is once again a nag on financial assets."
Adams, who tracks the stock-bond correlation alongside 12 other market signals, noted that disruptions to the prevailing correlation regime have historically preceded equity corrections. Shifts from the negative regime during the 1980s and 1990s briefly turned positive in 1987 and 1998 — years that produced the Black Monday crash and the near-collapse of Long-Term Capital Management, respectively. Similarly, correlation breakdowns in the positive regime that dominated from 2000 onward anticipated the 2007 equity peak, the 2015 global selloff, and the 2022 bear market.
"After holding a positive regime stance since April 2025, the correlation has once again lost its bearings and has rapidly shifted into negative territory," Adams said.
The Canary in A Coal Mine
What is different this time, analysts say, is that the 2023-to-2025 recovery offered a false sense of resolution.
After the Fed's rate increases crested and inflation moderated, the stock-yield correlation turned negative again — restoring the old ballast dynamic and producing meaningful recoveries for balanced portfolios in 2024 and into early 2025. That rebound, the Icarus Asia note argues, was not evidence that correlation shifts had been permanently broken by structural inflation. It was evidence of how quickly and completely regimes can reverse.
The current shift is being driven by a recognizable confluence: escalating Middle East tensions feeding energy price shocks, a fiscal stance that has kept the U.S. deficit near 6% to 7% of GDP, and a labor market that is cooling slowly enough to keep wage inflation elevated. Core PCE reacceleration has, in the RSQE nowcast, outpaced the Fed's 2% target by more than two percentage points on an annualized basis.
For institutional investors, the practical implications are not trivial.
A positive stock-bond return correlation — which is what a negative stock-yield correlation implies, given that bond prices move inversely to yields — means that in a stress event, bonds and equities decline together. The hedge built into the classic balanced portfolio disappears precisely when it is needed most.
The Icarus Asia note stops short of calling for a wholesale reallocation.
It frames the correlation shift as a risk-state variable, an input to stress testing and scenario analysis rather than a reliable signal for timing equity exits. The historical record, it notes, is mixed: some correlation-regime disruptions have preceded significant drawdowns, and others have resolved without lasting damage. The 2022 breakdown itself fully reversed by 2023 to 2025.
What it does recommend is incremental adjustment — shortening fixed-income duration within bond allocations, modestly raising exposure to liquid real assets, and upgrading stress-testing frameworks to model correlation environments ranging from negative 0.30 to positive 0.30. The goal is not to predict the next correction but to ensure portfolios can absorb it across a range of scenarios, not just the benign one.
For now, markets are watching the inflation data. The next core PCE release and Consumer Price Index report will either confirm the reacceleration or give the Fed room to signal a return to easing. Until one of those things happens, the correlation regime — and the question of what bonds are actually worth in a balanced portfolio — remains unresolved.
The author is the Head of Research and Analysis at Hong Kong-based Icarus Asia, a risk and advisory business.
Disclaimer
This report contains forward-looking statements based on current assumptions and estimates. Actual outcomes may differ materially. Icarus Asia, and the author of this article, make no representation as to the completeness or accuracy of this analysis. This is not investment advice.